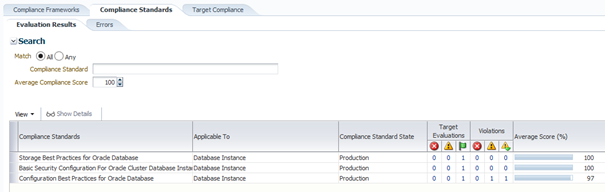
With Enterprise Manager Cloud Control 12c configuring and using the compliance standard utility allows us to discover events we should not have seen in other ways. Today at a customer’s site I discovered the following message:
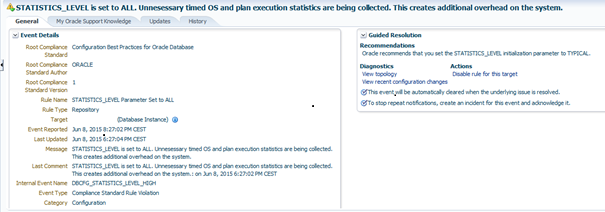
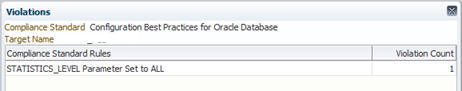
The configuration Best Practice for Oracle Database discovered the statistics_level parameter was set to the value ALL.
By selecting the Violation in the Configuration Best Practice for Oracle Database, we can display the message:
By the way Oracle recommends setting this value to TYPICAL in place of ALL, because of possible additional overhead on the system. If we look at the different statistics collected in TYPICAL or ALL modes, we can see that the difference concerns Plan Execution Statistics and Timed OS Statistics:
SQL> SELECT statistics_name,session_status,system_status,
activation_level,session_settable
FROM   v$statistics_level
ORDER BY statistics_name;
Typical:
STATISTICS_NAME                                        SESSION_ SYSTEM_S ACTIVAT SES
Active Session History                                    ENABLED ENABLED TYPICAL NO
Adaptive Thresholds Enabled                               ENABLED ENABLED TYPICAL NO
Automated Maintenance Tasks                               ENABLED ENABLED TYPICAL NO
Bind Data Capture                                         ENABLED ENABLED TYPICAL NO
Buffer Cache Advice                                       ENABLED ENABLED TYPICAL NO
Global Cache Statistics                                   ENABLED ENABLED TYPICAL NO
Longops Statistics                                        ENABLED ENABLED TYPICAL NO
MTTR Advice                                               ENABLED ENABLED TYPICAL NO
Modification Monitoring                                   ENABLED ENABLED TYPICAL NO
PGA Advice                                                ENABLED ENABLED TYPICAL NO
Plan Execution Sampling                                   ENABLED ENABLED TYPICAL YES
Plan Execution Statistics                                 DISABLED DISABLED ALL   YES
SQL Monitoring                                            ENABLED ENABLED TYPICAL YES
Segment Level Statistics                                  ENABLED ENABLED TYPICAL NO
Shared Pool Advice                                        ENABLED ENABLED TYPICAL NO
Streams Pool Advice                                       ENABLED ENABLED TYPICAL NO
Threshold-based Alerts                                    ENABLED ENABLED TYPICAL NO
Time Model Events                                         ENABLED ENABLED TYPICAL YES
Timed OS Statistics                                       DISABLED DISABLED ALL   YES
Timed Statistics                                          ENABLED ENABLED TYPICAL YES
Ultrafast Latch Statistics                                ENABLED ENABLED TYPICAL NO
Undo Advisor, Alerts and Fast Ramp up                     ENABLED ENABLED TYPICAL NO
V$IOSTAT_* statistics                                     ENABLED ENABLED TYPICAL NO
ALL:

STATISTICS_NAME                                        SESSION_ SYSTEM_S ACTIVAT SES
Active Session History                                    ENABLED ENABLED TYPICAL NO
Adaptive Thresholds Enabled                               ENABLED ENABLED TYPICAL NO
Automated Maintenance Tasks                               ENABLED ENABLED TYPICAL NO
Bind Data Capture                                         ENABLED ENABLED TYPICAL NO
Buffer Cache Advice                                       ENABLED ENABLED TYPICAL NO
Global Cache Statistics                                   ENABLED ENABLED TYPICAL NO
Longops Statistics                                        ENABLED ENABLED TYPICAL NO
MTTR Advice                                               ENABLED ENABLED TYPICAL NO
Modification Monitoring                                   ENABLED ENABLED TYPICAL NO
PGA Advice                                                ENABLED ENABLED TYPICAL NO
Plan Execution Sampling                                   ENABLED ENABLED TYPICAL YES
Plan Execution Statistics                                 ENABLED ENABLED ALL     YES
SQL Monitoring                                            ENABLED ENABLED TYPICAL YES
Segment Level Statistics                                  ENABLED ENABLED TYPICAL NO
Shared Pool Advice                                        ENABLED ENABLED TYPICAL NO
Streams Pool Advice                                       ENABLED ENABLED TYPICAL NO
Threshold-based Alerts                                    ENABLED ENABLED TYPICAL NO
Time Model Events                                         ENABLED ENABLED TYPICAL YES
Timed OS Statistics                                       ENABLED ENABLED ALL     YES
Timed Statistics                                          ENABLED ENABLED TYPICAL YES
Ultrafast Latch Statistics                                ENABLED ENABLED TYPICAL NO
Undo Advisor, Alerts and Fast Ramp up                     ENABLED ENABLED TYPICAL NO
V$IOSTAT_* statistics                                     ENABLED ENABLED TYPICAL NO
Another side effect is documented in the 874518.1 Oracle Metalink note. The statistics_level parameter initiated to ALL records a lot of additional information in the AWR repository, the table wrh$_latch_chidren might grow to a huge size.
For example in a database with statistics_level set to ALL:
SQL> SELECT sum(bytes)from dba_segments
where SEGMENT_NAME ='WRH$_LATCH_CHILDREN';

SUM(BYTES)
1985085440
And with statistics_level set to for TYPICAL:
SQL> SELECT sum(bytes)from dba_segments
where SEGMENT_NAME ='WRH$_LATCH_CHILDREN';

SUM(BYTES)
262144
Another proof consists at looking the object occupying most of the place in the SYSAUX tablespace:
With statistics_level set to TYPICAL:
SQL> select * from
2   (select owner,segment_name,bytes/(1024*1024) size
3   from dba_segments
4   where tablespace_name = 'SYSAUX'
5   ORDER BY BLOCKS desc);

OWNER              SEGMENT_NAME                         SIZE

SYS              WRH$_ACTIVE_SESSION_HISTORY            1242

SYS              WRM$_SNAPSHOT_DETAILS_INDEX             629

SYS              WRH$_EVENT_HISTOGRAM_PK                 596

….
With statistics_level set to ALL:
OWNER             SEGMENT_NAME                          SIZE

SYS              WRH$_LATCH_CHILDREN                    1893

SYS              WRH$_LATCH_CHILDREN_PK                 1368

SYS              SYS_LOB0000006298C00004$$               580

…
We can obviously see that the two segments WRH$_LATCH_CHILDREN and WRH$_LATCH_CHILDREN_PK are the biggest objects in the SYSAUX tablespace where statistics_level is set to ALL.
Conclusion:
I would recommend to always let the default value for statistics_level (i.e TYPICAL), but if you need to set statistics_level to ALL in order to diagnose SQL plan performance issues, you can do it at session level:
SQL> alter session set statistics_level='ALL';
Session altered.
![Thumbnail [60x60]](https://www.dbi-services.com/blog/wp-content/uploads/2022/12/oracle-square.png)
![Thumbnail [90x90]](https://www.dbi-services.com/blog/wp-content/uploads/2022/08/STH_web-min-scaled.jpg)
![Thumbnail [90x90]](https://www.dbi-services.com/blog/wp-content/uploads/2022/08/FRJ_web-min-scaled.jpg)
![Thumbnail [90x90]](https://www.dbi-services.com/blog/wp-content/uploads/2024/01/HME_web.jpg)
![Thumbnail [90x90]](https://www.dbi-services.com/blog/wp-content/uploads/2022/10/STS_web-min-scaled.jpg)