Few months ago, a customer asks me for finding in a column, how many rows exist with the same date & time and the delta between them. The column default value is based on the function CURRENT_TIMESTAMP and used as key as well.
This is obviously a very bad idea but let’s go ahead…
This anti pattern may lead to a lot of duplicate keys and the customer wanted to get a picture of the situation.
To perform this task, I used the following example which includes a temporary table with one column with a datetime format:
CREATE TABLE [#tmp_time_count] (dt datetime not null)
Let’s insert a bunch a rows with CURRENT_TIMESTAMP function in the temporary table:
INSERT INTO [#tmp_time_count] SELECT CURRENT_TIMESTAMP
Go 1000
To get distinct datetime values , I used DISCTINCT and COUNT functions as follows:
SELECT COUNT(DISTINCT dt) as [number_of_time_diff] from [#tmp_time_count]
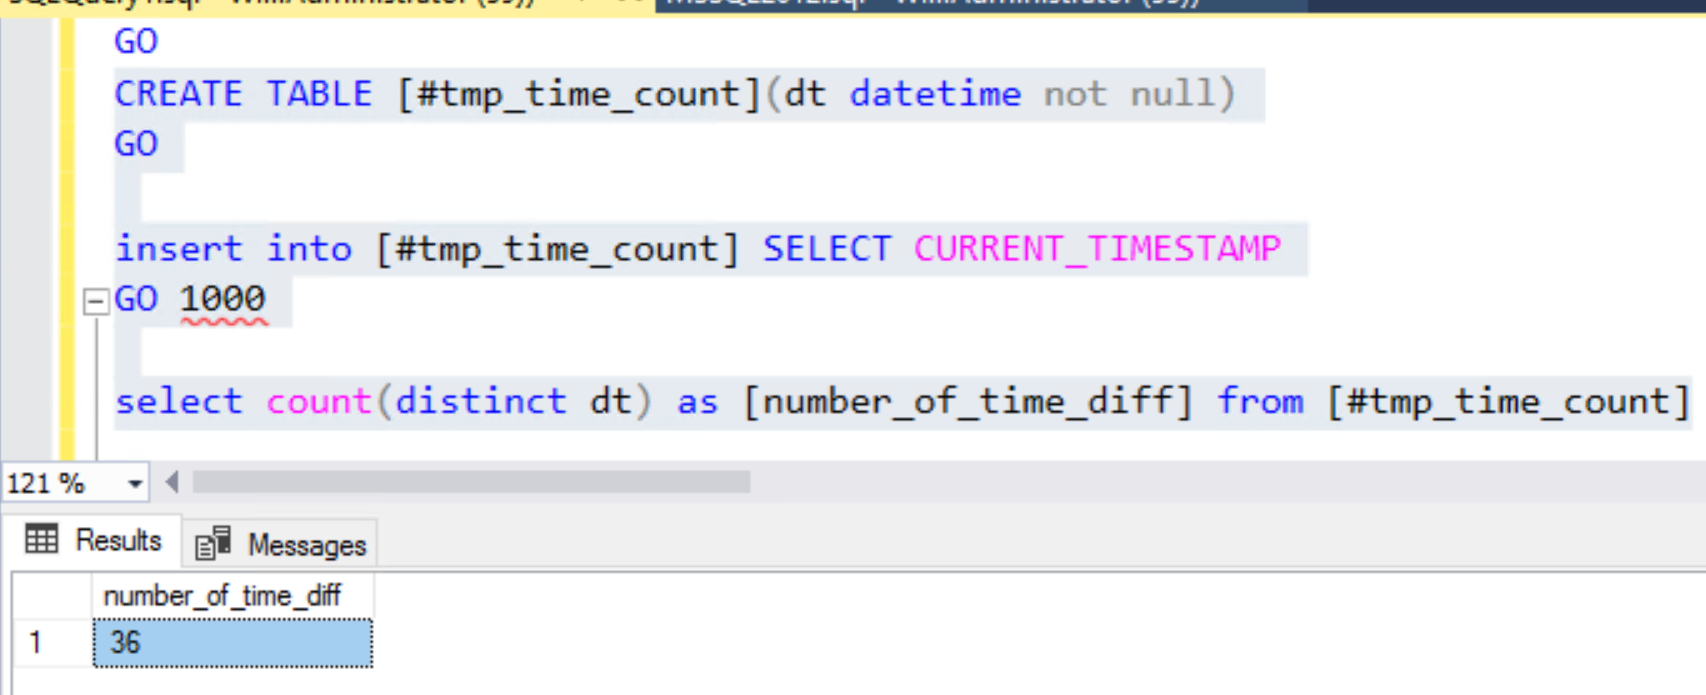
In my test, I find 36 different times for 1000 rows.
The question now is to know how many I have on the same date & time…
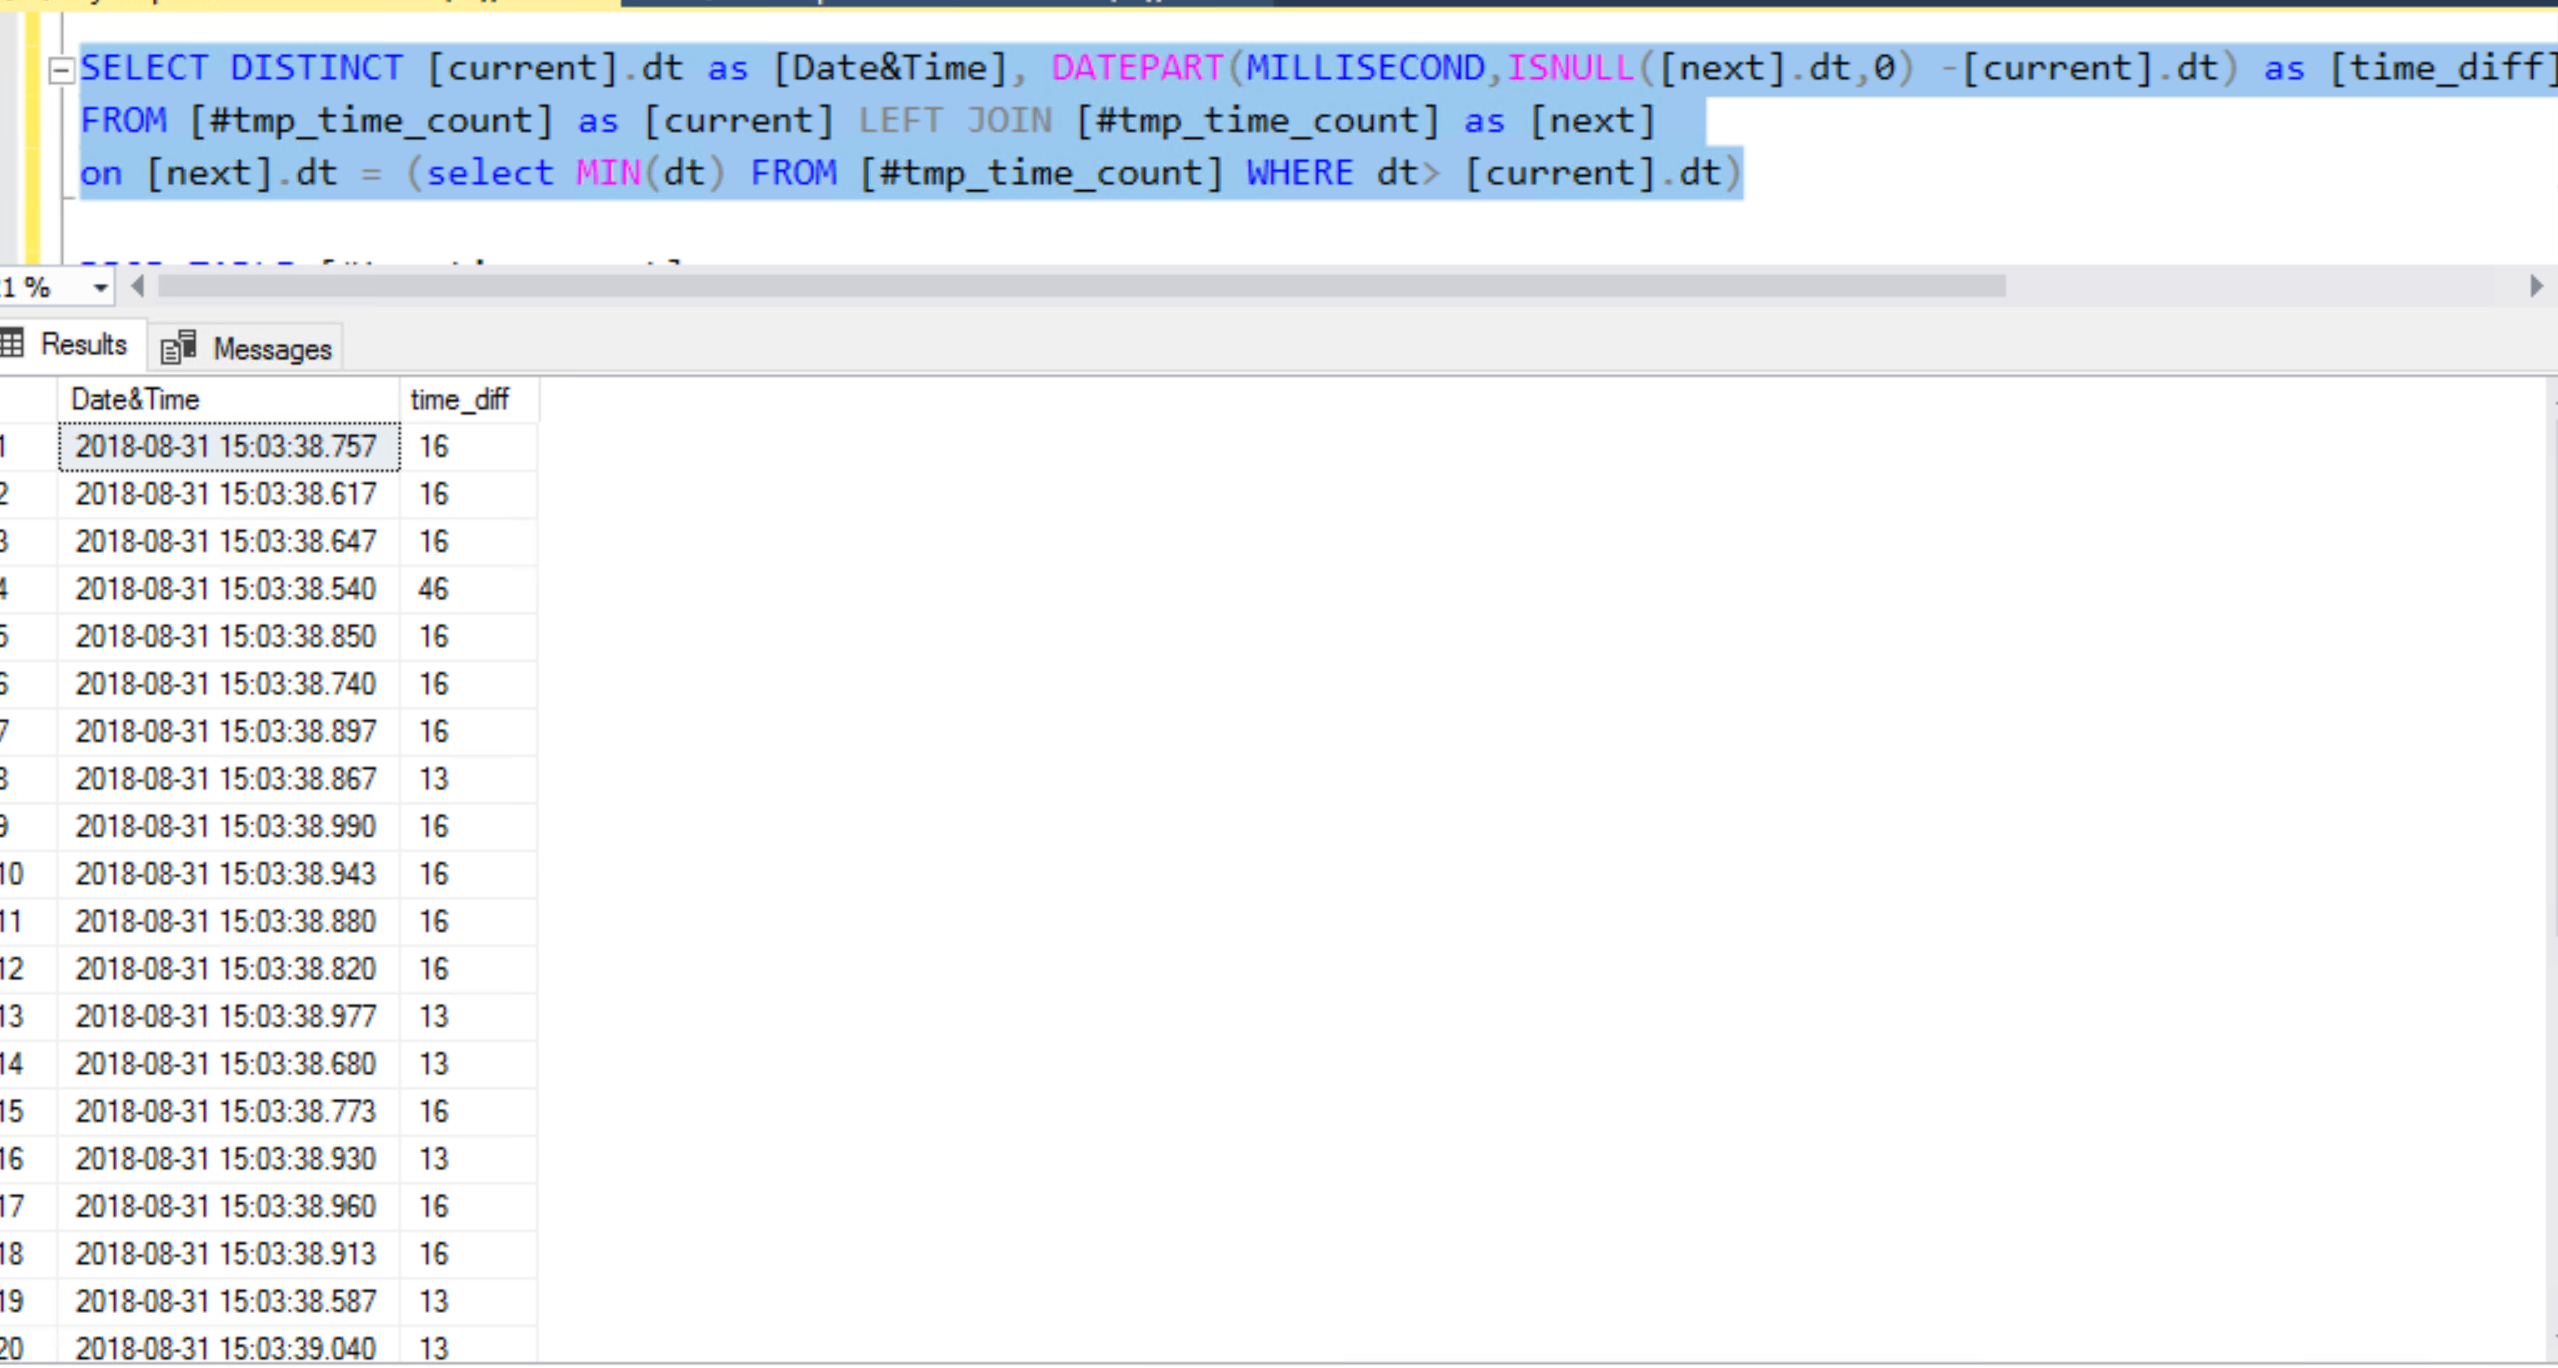
To have this information, I try a lot of thing but finally, I write this query with a LEFT JOIN on the same table and a DATEPART on the datetime’s column.
SELECT DISTINCT [current].dt as [Date&Time], DATEPART(MILLISECOND,ISNULL([next].dt,0) –[current].dt) as [time_diff] FROM [#tmp_time_count] as [current] LEFT JOIN [#tmp_time_count] as [next] on [next].dt = (SELECT MIN(dt) FROM [#tmp_time_count] WHERE dt >[current].dt)
Finally, don’t forget to drop the temporary table….
DROP TABLE [#tmp_time_count];
Et voila! I hope this above query will help you in a similar situation… But it’s not finished!
Having discussed this blog post with my colleague David Barbarin, he suggested I continue to dig further with the performance aspect by inserting more rows (let’s say 100000 rows as new exemple for this blog post).
let’s go!
To perform this test, I enabled STATISTICS TIME & IO options to get a picture of query execution statistics for each test.
SET STATISTICS TIME ON
GO
SET STATISTICS IO ON
GO
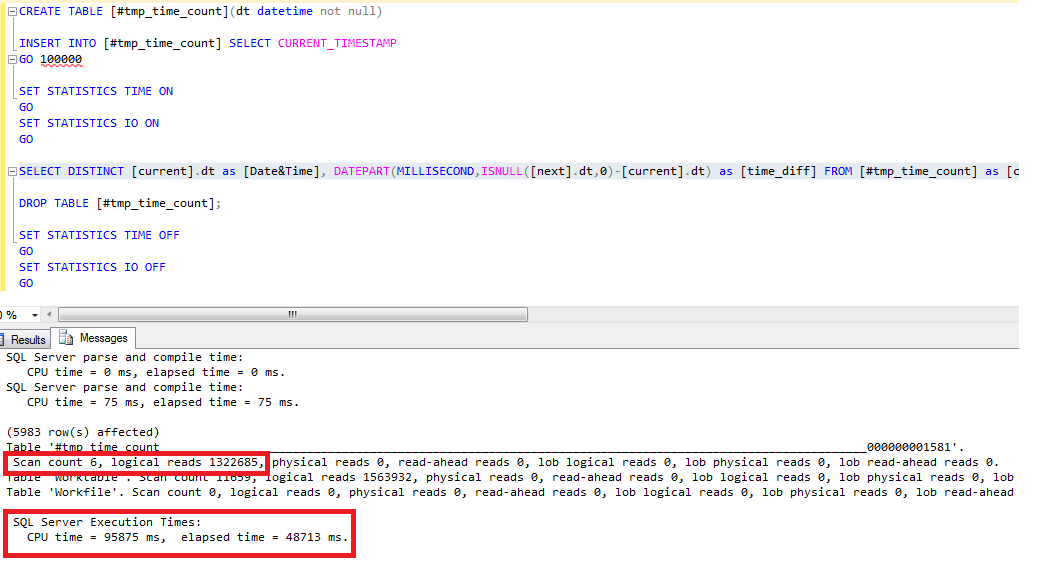
As you can see on the screenshot, the CPU time is 95875ms with an number of 1322685 logical reads.
This is the first step to the optimization process. I added then the following non-clustered Index:
CREATE NONCLUSTERED INDEX [dt_idx] ON [dbo].[#tmp_time_count]
(
	[dt] ASC
)
GO
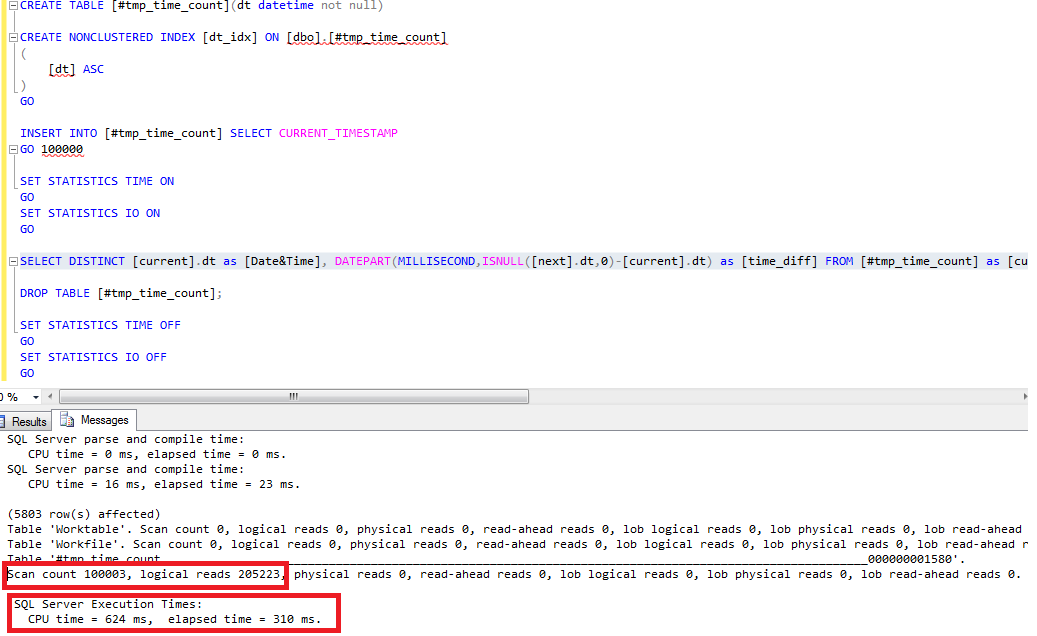
After the query execution, the new result is very better, because the CPU time dropped to 624ms with a number of logical reads equals to 205223.
Adding an index was helpful to get a better result but the query execution time is still tied to the number of rows in the table
To get a more consistent result , David proposed one another possible solution including the LEAD function started since SQL Server 2012.
The new query becomes:
SELECT [current].dt, DATEPART(MILLISECOND, LEAD([current].dt, 1, 0) OVER (ORDER BY [current].dt) - [current].dt) AS [time_diff]
FROM  [#tmp_time_count] AS [current]
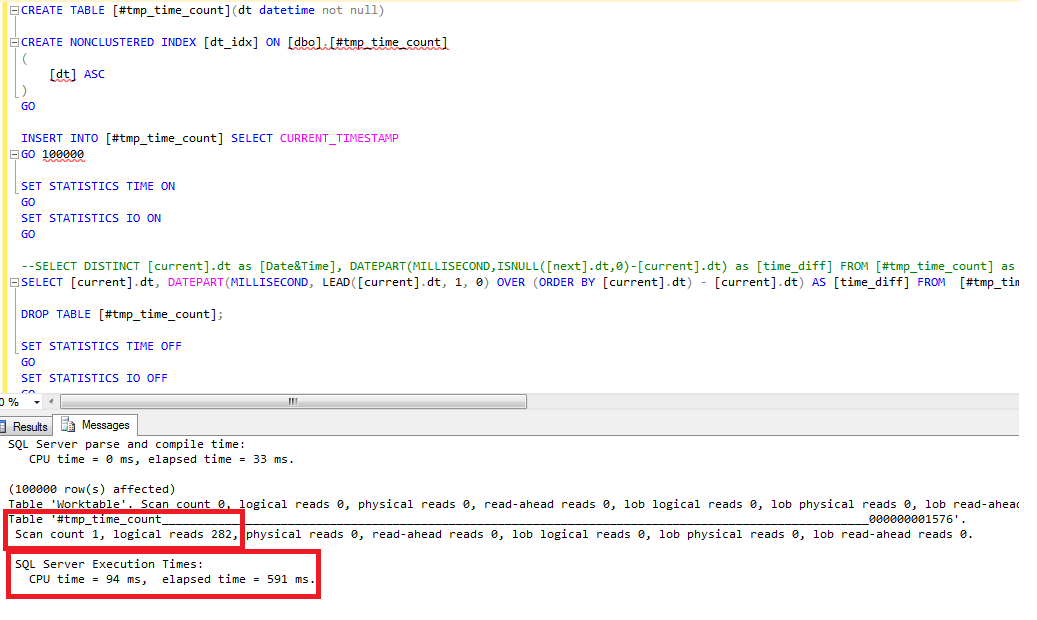
After running the query, CPU Time is 94ms with a number of logical reads equals to 282.
I was very impressed by the result with just the creation of an index and the use of the Lead function as well.
So, if you face a similar situation with a high volume of data, prefer working with this last query.
It was also a good reminder to have a look at the new T-SQL functions shipped with SQL Server to get faster.
Thank you David to challenge me on this topic!
![Thumbnail [60x60]](https://www.dbi-services.com/blog/wp-content/uploads/2022/08/STH_web-min-scaled.jpg)
![Thumbnail [90x90]](https://www.dbi-services.com/blog/wp-content/uploads/2023/01/APY_web-scaled.jpg)
![Thumbnail [90x90]](https://www.dbi-services.com/blog/wp-content/uploads/2025/11/LTO_WEB.jpg)
![Thumbnail [90x90]](https://www.dbi-services.com/blog/wp-content/uploads/2022/08/FRJ_web-min-scaled.jpg)