I have an interested alert on SCOM for SQL Server by a customer two weeks ago.
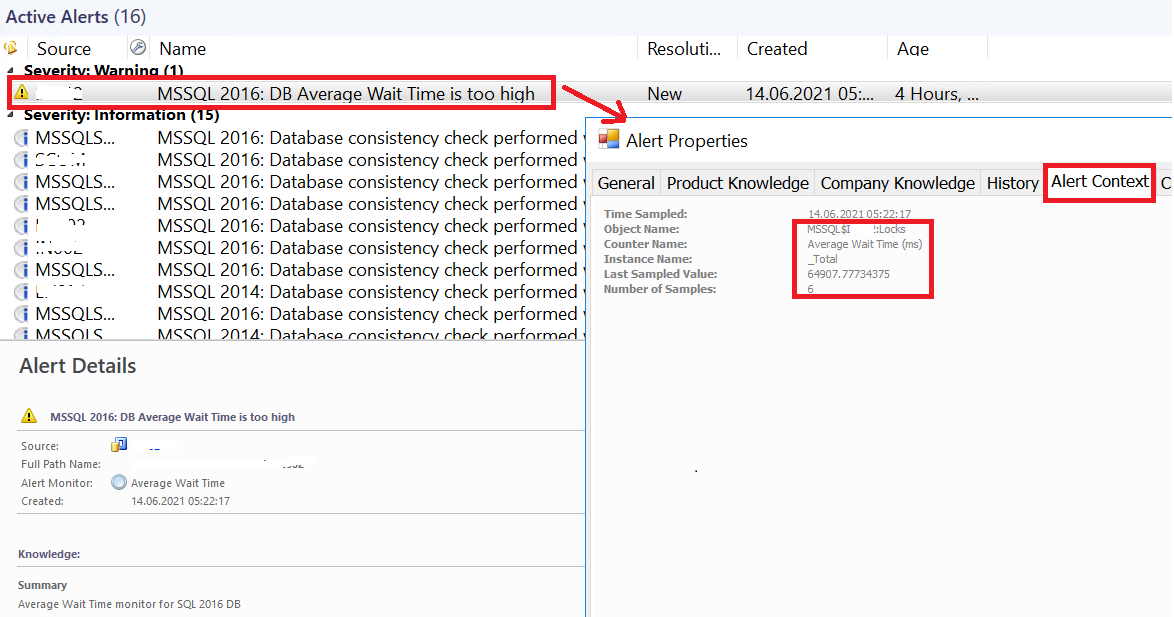
In the SCOM interface, the warning on the server is MSSQL2016: The Average Wait Time of SQL instance “xxx” on computer “xxx” is too high.
After right-click on the properties, go to the tab Alert Context. On this part, you can see that the Object Name is MSSQL$xxx:Locks.
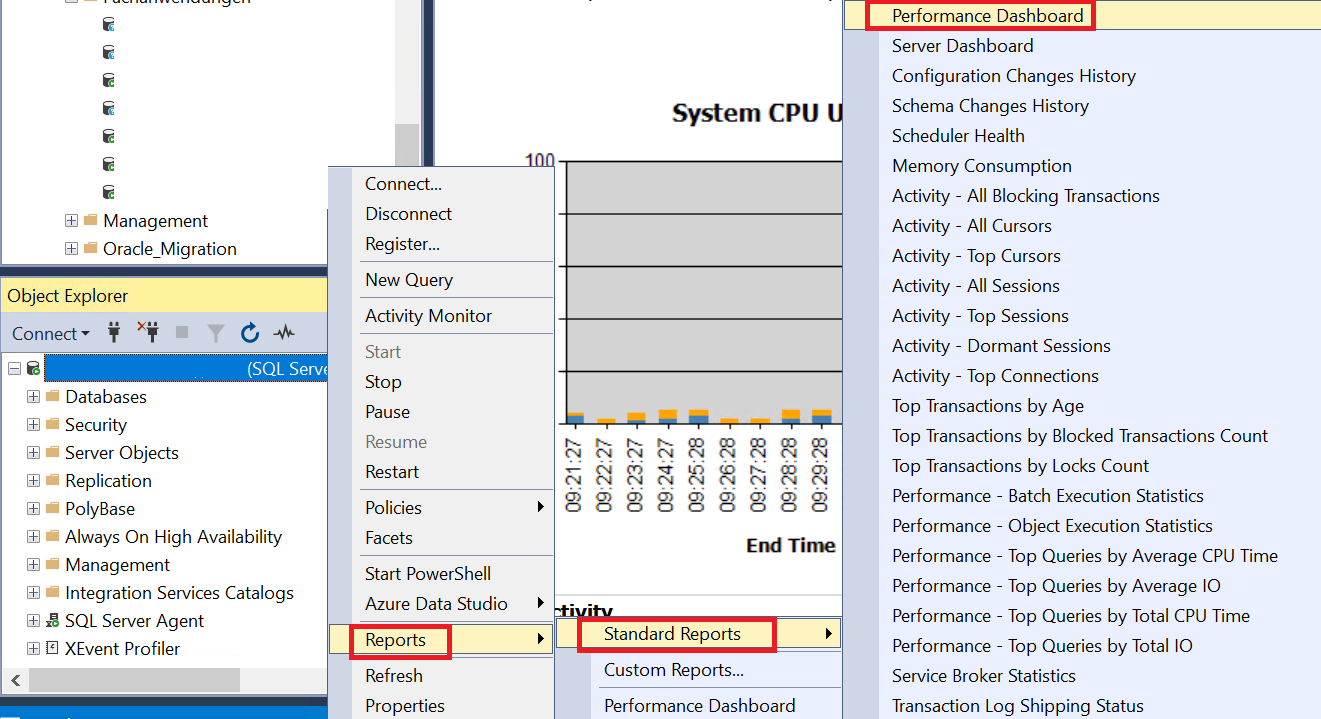
My first step is to go in the Reports>Standard Reports> Performance Dashboard to have more information
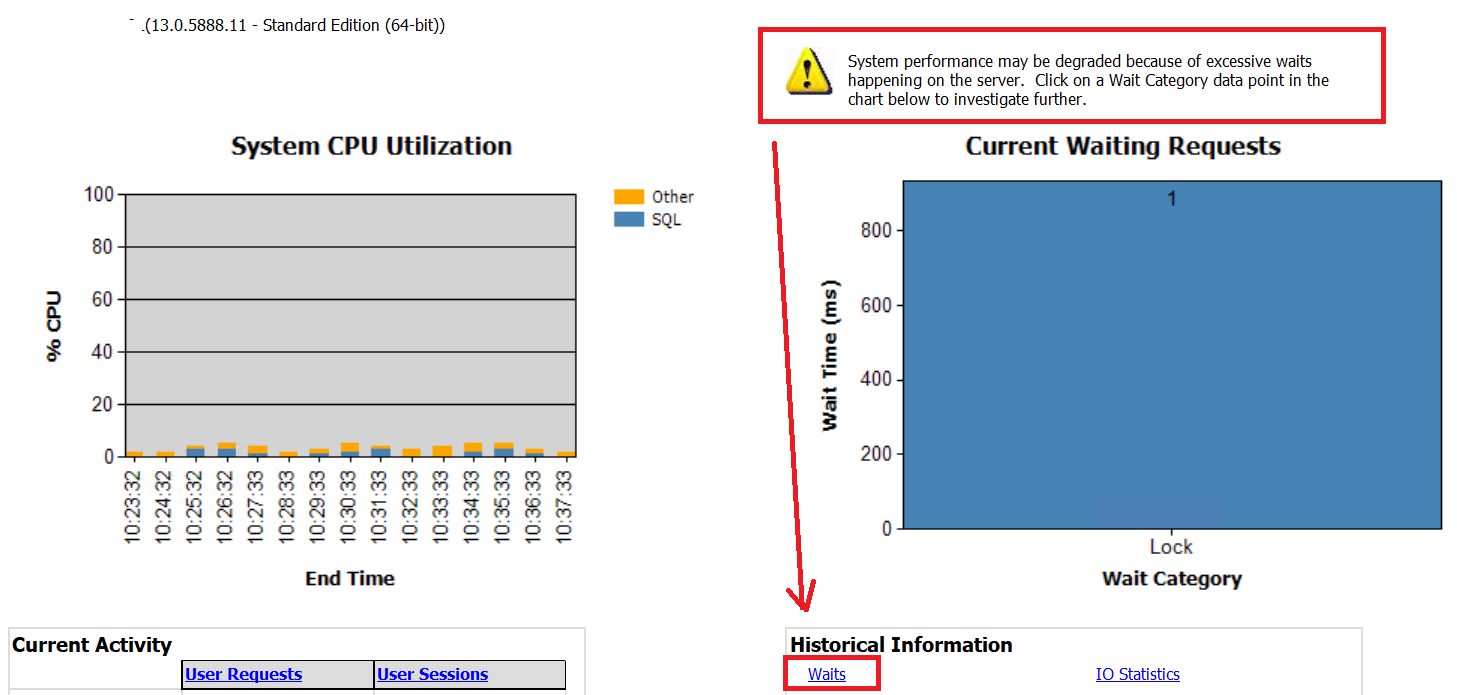
In this reports, the first graph is about CPU usage and the second one about the waits.
In my case, we can see that one wait is very very high: Lock.
In the Historical Information, click on waits to have the details.
With the Detail, we see two main locks: LCK_M_IS and LCK_M_S:
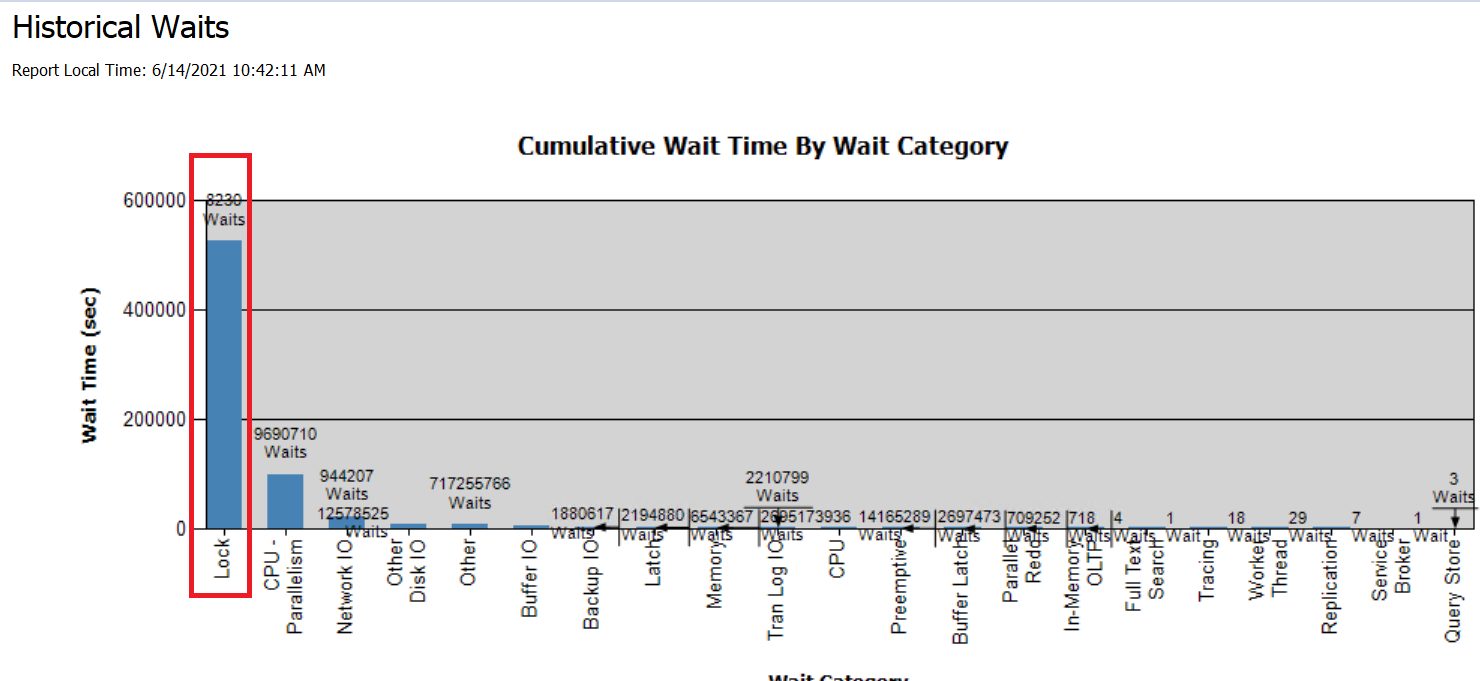
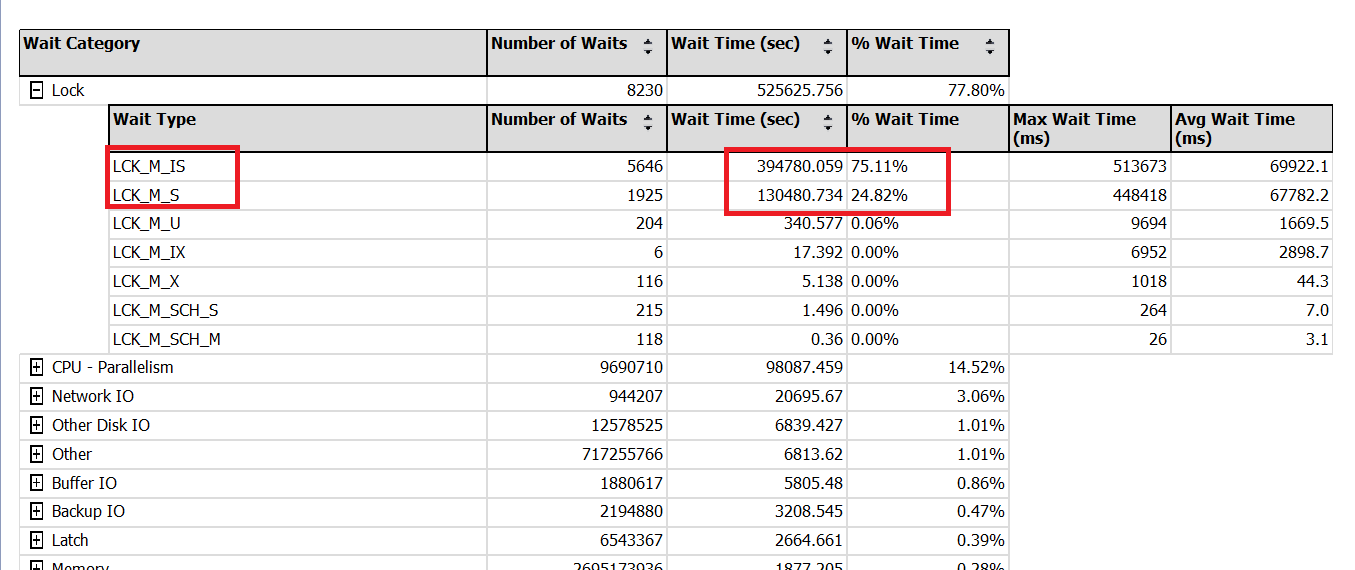
LCK_M_IS: This wait type is when a thread is waiting to acquire an Intent Shared lock on a resource and there is at least one other lock in an incompatible mode granted on the resource to a different thread. link here for more detail.
LCK_M_S: This wait type is when a thread is waiting to acquire a Shared lock on a resource and there is at least one other lock in an incompatible mode granted on the resource to a different thread. link here for more detail.
After searching the object, I see the database and analyse the queries on it.
To resolve this issue, I add 3GB memory and add a new index on the table with the queries impacting these two locks.
One week later, no more locks!
I hope this blog will help you to analyse also through the dashboard how to fix a lock problem.
![Thumbnail [60x60]](https://www.dbi-services.com/blog/wp-content/uploads/2022/08/STH_web-min-scaled.jpg)
![Thumbnail [90x90]](https://www.dbi-services.com/blog/wp-content/uploads/2023/01/APY_web-scaled.jpg)
![Thumbnail [90x90]](https://www.dbi-services.com/blog/wp-content/uploads/2025/11/LTO_WEB.jpg)
![Thumbnail [90x90]](https://www.dbi-services.com/blog/wp-content/uploads/2022/08/FRJ_web-min-scaled.jpg)