Let’s start the story from the beginning with some funny testing I tried to perform with SQL Server on Linux a couple of months ago. At that time, I wanted to get some pictures of syscalls from SQL Server as I already did in a past on Windows side with sysinternal tools as procmon and stack traces. On Linux strace is probably one of the best counterparts.

Firstly, please note this blog is just from my own researches and it doesn’t constitute in any cases an official documentation from Microsoft and may lead likely to some inaccuracies. This kind of write up is definitely not easy especially when you’re not the direct developer of the product and because things change quickly nowadays making at the same time your blog post biased 🙂 Anyway, I was just curious to figure out how SQL Server deals with I/O on Linux side and the main safety point here is certainly to show how you may achieve it on Linux. So let’s start from the beginning with already what we know on the Windows operating system: The SQL Server engine goes through Win32 API and functions like CreateFile(), ReadFile(), WriteFile() to deal with I/O but let’s focus specifically on the CreateFile() function here. CreateFile() is used to create or to open an existing file or an I/O device with some specific flags. Some of them as FILE_FLAG_WRITE_THROUGH are used to meet the Write-Ahead Logging (WAL) Protocol by bypassing all system / disk caches (cf. Microsoft article).
On April 10 2018 I did my first tests on the Linux side with SQL Server 2017 CU5 and here was my first strace output after creating dbi_db database:
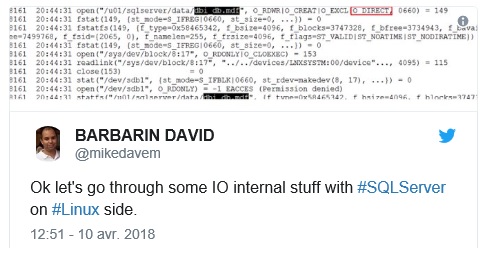
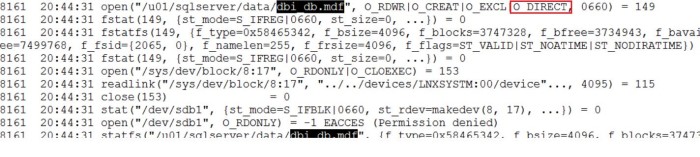
It was an expected output for me because on Linux SQL Server uses an low-level open() system call – that is the counterpart of createfile() on Windows – but the surprising thing was with O_DIRECT flag only. I’m not a system developer and from my position, I may understand benefits from using O_DIRECT with database systems because it is driving by AIO (asynchronous I/O) and by the fact we may completely bypass any kernel space buffers (by default on Linux). I get the opportunity to thanks @dbaffaleuf with our interesting discussions on this topic
But referring to the documentation we may read the following sample as well about O_DIRECT:
File I/O is done directly to/from user-space buffers. The O_DIRECT flag on its own makes an effort to transfer data synchronously, but does not give the guarantees of the O_SYNC flag that data and necessary metadata are transferred
From my understanding using O_DIRECT that implies durable writes on block devices are not guaranteed and from my trace I noticed the transaction log seemed to be open with O_DIRECT in this case …
2837  20:44:32 open("/u02/sqlserverlog/mssqlserver/dbi_test_log.ldf", O_RDWR|O_CREAT|O_EXCL|O_DIRECT, 0660) = 187
2837  10:13:09 fstat(187, {st_mode=S_IFREG|0660, st_size=0, ...}) = 0
… From a WAL protocol perspective using such flag might lead to not meet the requirements because we might experience data loss in case of a system / storage outage unless either implementing another low-level mechanism like fsync() for transaction log and checkpoints or to be sure the storage guarantees writes are O_DIRECT safe. At this stage I expected to find out more fsync() related entries in my trace but no chance as shown below (I put only a sample but in fact no other relevant syscalls in the entire trace that might indicate forcing synchronization stuff)
% time     seconds  usecs/call     calls    errors syscall
------ ----------- ----------- --------- --------- ----------------
 72.59   12.993418        2089      6220      2503 futex
 10.78    1.929811        7509       257           epoll_wait
  9.08    1.625657       47813        34        28 restart_syscall
  3.28    0.587733        8643        68           io_getevents
  1.97    0.351806       70361         5           nanosleep
  1.92    0.344254       34425        10        10 rt_sigtimedwait
  0.32    0.056943           3     22116           clock_gettime
  0.02    0.003530         101        35           munmap
  0.01    0.002149          32        67           io_submit
  0.01    0.001706           6       273           epoll_ctl
  0.01    0.000897           6       154           read
  0.00    0.000765          11        68           writev
  0.00    0.000605           4       136        68 readv
  0.00    0.000591           4       137           write
  0.00    0.000381          10        40        23 open
  …
------ ----------- ----------- --------- --------- ----------------
100.00   17.900633                 29827      2638 total
A couple of weeks ago, I wanted to update my test environment with SQL Server 2017 CU8 (on Linux) I noticed the following messages (in the red rectangle):
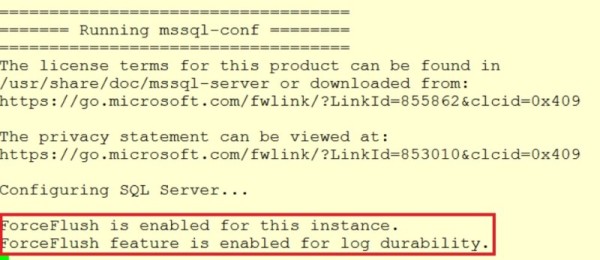
Hmm .. that was pretty new and interesting and in fact, the aforementioned messages were related to this Microsoft article (Thanks @Bobwardms to pointed me out). This new behavior is available since SQL Server 2017 CU6 and the article describes that how Microsoft has introduced a change with a new “forced flush” mechanism for SQL Server on Linux system.
In a nutshell for all scenarios, a new flush mechanism guarantees data is safely written to a stable media for transaction logs and during checkpoints. Let’s dig further into the both methods.
Let’s say first I applied the same pattern for all the tests that follow. The test’s protocol included one dbo.t1 table with only one column (id int). I inserted for each test a bunch of data rows (67 rows to be more precise related to 67 distinct implicit transactions) without any other user concurrent activities. It remains some internal stuff from SQL Server but I guess we may consider them as negligible compared to my tests.
insert dbo.t1 values (1)
go 67
- Default forced flush mechanism behavior
In this scenario referring to my strace file output database files are still open with O_DIRECT only as shown below (my database’s name is toto this time)
4745 10:54:34 open("/u01/sqlserverdata/mssqlserver/toto.mdf", O_RDWR|O_CREAT|O_EXCL|O_DIRECT, 0660) = 188
I also used the following command to get directly a picture summary of the number of calls per syscall
$ sudo strace -f -c -o sql_strace.txt $(pidof sqlservr |sed 's/\([0-9]*\)/\-p \1/g')
Here the sample output I got:
$ cat sql_strace.txt
% time     seconds  usecs/call     calls    errors syscall
------ ----------- ----------- --------- --------- ----------------
 71.36   24.078231        2685      8969      3502 futex
 12.13    4.093680      120402        34        30 restart_syscall
 10.03    3.384817       12583       269           epoll_wait
  2.67    0.901541       13258        68           io_getevents
  1.77    0.598830       46064        13        13 rt_sigtimedwait
  1.66    0.560893       93482         6           nanosleep
  0.23    0.077873           2     31422           clock_gettime
  0.09    0.030924         462        67           fsync
  0.01    0.003212         321        10           madvise
  0.01    0.003026          22       136           write
  …
------ ----------- ----------- --------- --------- ----------------
100.00   33.742080                 42195      3651 total
This time I noticed additional calls of fsync() to guarantee writes on blocks – 67 calls that seem to be related to 67 transactions right? I double checked in my strace output and it seems that is the case but I may be wrong on this point so please feel free to comment. Another interesting point is that I also continued to notice asynchronous IO from io_getevents function that appeared from my trace. That make sense for me. Writes of data are asynchronous while those on transaction logs are synchronous by design. In this mode fsync() is triggered during transaction commits and checkpoints.
- Enabling trace flag 3979
Enabling trace flag 3979 has effect to disable the forced flush behavior replaced by writethrough and alternatewritethrough options. Referring to the Microsoft article the former will translate the well-known FILE_FLAG_WRITE_THROUGH flag requests into O_DSYNC opens but with some performance optimization stuff by using fdatasync() rather than fsync() Indeed, fdatasync() is supposed to generate less I/O activity because it doesn’t require to synchronize file metadata (only the data portion of the file is concerned here).
Anyway, my strace sample file output below confirmed that both data file and transaction log were open with both O_DIRECT and O_DSYNC meaning we are bypassing the kernel buffer space and we are also forcing synchronous I/O for both files. Does it matter? Well, from my understanding writing dirty data pages is still an asynchronous process when checkpoints occur. How much better it performs in this case? I don’t know and it will require likely another bunch of strong tests on different use cases –
5279  11:07:36 open("/u01/sqlserverdata/mssqlserver/dbi_test.mdf", O_RDWR|O_CREAT|O_EXCL|O_DSYNC|O_DIRECT, 0660) = 185
…
5279  11:07:38 open("/u02/sqlserverlog/mssqlserver/dbi_test_log.ldf", O_RDWR|O_CREAT|O_EXCL|O_DSYNC|O_DIRECT, 0660) = 185
As previously I noticed 67 calls of fdatasync() (and not anymore fsync() here) related likely to my 67 implicit transactions and I still continued to notice asynchronous IO driving by io_getevents() or io_submit() syscalls.
% time     seconds  usecs/call     calls    errors syscall
------ ----------- ----------- --------- --------- ----------------
 73.90   12.678046        2360      5371      1927 futex
 10.80    1.853571        7788       238           epoll_wait
  9.05    1.551962       45646        34        30 restart_syscall
  1.93    0.331275       47325         7         7 rt_sigtimedwait
  1.84    0.316524      105508         3           nanosleep
  1.61    0.276806        4131        67           io_getevents
  0.71    0.121815           7     18259           clock_gettime
  0.06    0.010184         152        67           fdatasync
  0.02    0.003851          26       146           read
  0.02    0.003217          12       272           epoll_ctl
  0.01    0.002139          32        67           io_submit
  0.01    0.002070          15       136           write
  …
------ ----------- ----------- --------- --------- ----------------
100.00   17.156630                 25170      2054 total
Finally, at the moment of this write up, let’s say that Microsoft recommends enabling the trace flag 3979 as well as changing the default values of writethrough and alternatewritethrough options to 0 to revert back to old behavior before CU6 illustrated in the first section of this blog post but only in the case your storage guarantees your writes will be “O_DIRECT” safe. I think you may understand why now – if my understanding of Linux I/O is obviously correct- 🙂
See you!
By David Barbarin
![Thumbnail [60x60]](https://www.dbi-services.com/blog/wp-content/uploads/2022/12/microsoft-square.png)
![Thumbnail [90x90]](https://www.dbi-services.com/blog/wp-content/uploads/2022/08/STH_web-min-scaled.jpg)
![Thumbnail [90x90]](https://www.dbi-services.com/blog/wp-content/uploads/2022/11/TBR-web-min-scaled.jpg)
![Thumbnail [90x90]](https://www.dbi-services.com/blog/wp-content/uploads/2025/11/LTO_WEB.jpg)
![Thumbnail [90x90]](https://www.dbi-services.com/blog/wp-content/uploads/2023/01/APY_web-scaled.jpg)