I ran into an interesting scenario with a customer that I want to share in this blog post.
This customer is running a data-loading activity on a monthly basis from his business application.
He did not complain about the performance, the time of this activity is quite correct.
But, I was asked to monitor the activity from an SQL Server point of view. The goal was to ensure that there were no obvious performance issues caused by a misconfiguration or an SQL query requiring tuning.
Some performance metrics
While the workload was running I observed different things, SQL activity with sp_whoIsActive, memory usage by observing Memory Clerks size, plan cache usage, wait statistics, etc…
During the SQL activity, I did not notice any obvious performance problems.
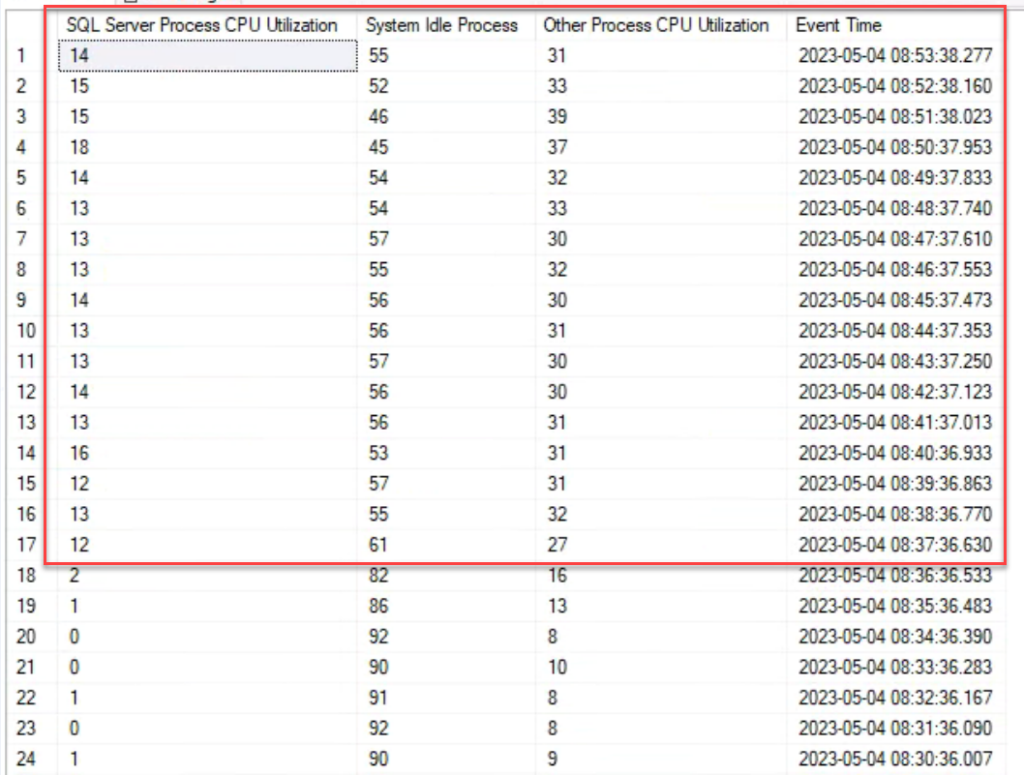
Here is a view of the CPU activity. The CPU load increase is visible during data loading, as expected. Most of the time this server is idling. Yet, nothing alarming with only 15% CPU usage on average.
The query used below can be found in Glenn Berry’s diagnostic queries; titled “CPU Utilization History”
In terms of SQL Server wait statistics, there was nothing special to report either.
This is one of many small samples I took. You can also do this using Paul Randal’s script.
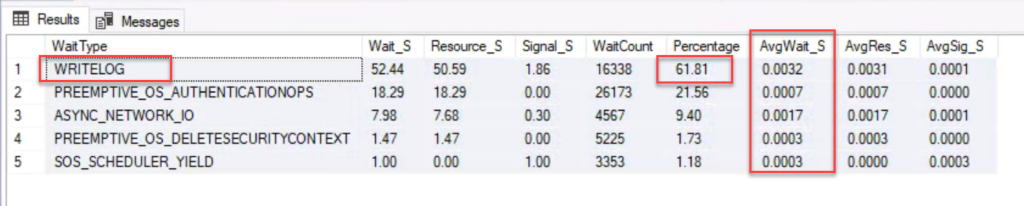
What comes out first is a WRITELOG wait type that corresponds to INSERT queries. This is normal. The duration of these waits is quite negligible.
Plan cache
Looking at the execution plan cache we can see the limit of the number of cached entries has been reached. It is by default around 160,000.
SELECT
	[objtype] AS CacheType,
	COUNT_BIG(*) AS TotalPlans,
	AVG(CAST([usecounts] AS BIGINT)) AS AvgUseCount,
	MAX(CAST([usecounts] AS BIGINT)) AS MaxUseCount,
	SUM(CAST([size_in_bytes] AS BIGINT))/1024/1024 AS TotalSizeMB,
	SUM((CASE WHEN CAST([usecounts] AS BIGINT)=1
		THEN CAST([size_in_bytes] AS BIGINT) ELSE 0 END))/1024/1024 AS TotalMBforUSECount1,
	SUM(CASE WHEN CAST([usecounts] AS BIGINT)=1 THEN 1 ELSE 0 END) AS TotalPlansUSECount1
FROM sys.dm_exec_cached_plans
GROUP BY objtype
ORDER BY TotalMBforUSECount1 DESC;
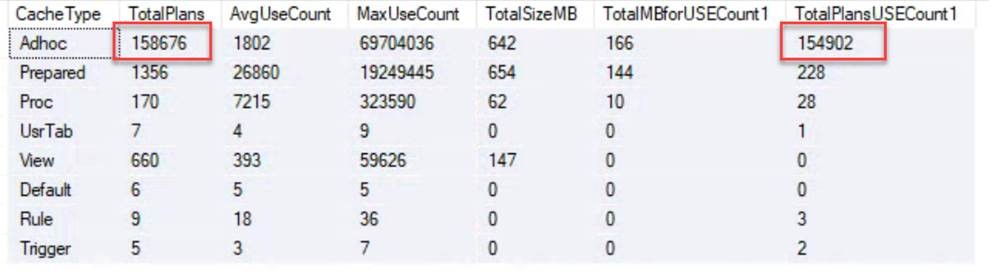
These are almost all execution plans of Ad hoc queries executed only once.
The memory size consumed by these plans is reduced (166MB) because the option “Optimize for ad-hoc workloads” is enabled at the instance level.
So at least there is no issue with significant memory pressure on the data cache (Buffer Pool).
In scenarios like this, the query_hash is useful. A query_hash is a calculated value that identifies queries that differ only in literal values. We can count and identify the queries bloating the cache.
SELECT query_hash, COUNT(query_hash) AS PlanCount
FROM sys.dm_exec_query_stats
GROUP BY query_hash
ORDER BY PlanCount DESC
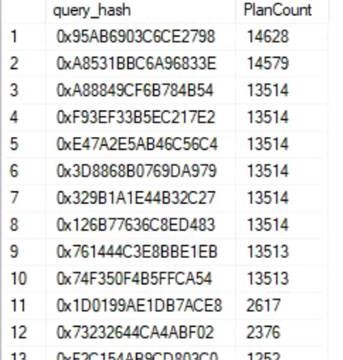
We can see that about ten unparameterized queries are filling the execution plan cache.
Compilation time
Memory considerations aside, the disadvantage of Ad hoc plans polluting the cache is the compilation cost. There is a CPU cost associated with generating the execution plans. It can also take time, up to several hundred milliseconds for very complex queries.
There SQL queries polluting the cache and running over and over by the data loading activity are very simple queries. I looked at the query text of each of them using the query_hash value.
Their compilation time is very short, between 1 and 3 milliseconds.
You can get your query compilation time from various places, if you are interested; from the Query Store, Extended Events, and execution plans.
From what I observed with Perfmon while the activity was running, the number of SQL compilations was about 250 per second.
Considering an average of 1.5 milliseconds of compilation time, this gives 250*1.5ms/4 CPU cores: 93 milliseconds are spent each second by the CPUs to perform compilations.
We end up with 9% of CPU time for compilations (based on this high estimate of 1.5ms on average). This seems consistent with the average CPU time of the instance at 15% as seen previously.
Parametrization
Pollution of the plan cache can be avoided by updating the application code to use a method that parametrizes queries instead of using literal values. This can be difficult, expensive and take a few months depending on whether your application is developed in-house or you depend on a vendor.
Another option is to enable the Forced parametrization at the database level. The downside is that obviously it could introduce parameter-sensitivy problems. Forced parametrization is Forced Parameter Sniffing.
Conclusion
In this particular case, I didn’t found that the plan cache saturation is causing a significant negative impact on performance.
The data loading activity being ocasional and the customer being satisfied with the loading time, I did not perform any actions on this environment.
For cases with a high number of query compilation and where lowering CPU utilization and response time is critical for your workload, updating the code to make queries parametrized or using force parameterization can help.
Written by Steven Naudet
![Thumbnail [60x60]](https://www.dbi-services.com/blog/wp-content/uploads/2022/12/microsoft-square.png)
![Thumbnail [90x90]](https://www.dbi-services.com/blog/wp-content/uploads/2023/01/APY_web-scaled.jpg)
![Thumbnail [90x90]](https://www.dbi-services.com/blog/wp-content/uploads/2024/01/HME_web.jpg)
![Thumbnail [90x90]](https://www.dbi-services.com/blog/wp-content/uploads/2022/10/STS_web-min-scaled.jpg)
![Thumbnail [90x90]](https://www.dbi-services.com/blog/wp-content/uploads/2024/03/AHI_web.jpg)