
I have recently come across an issue with one of my customer that told me that their SQL Server 2008 R2 instance had a memory leak. These are strong words! The server has 64 GB of RAM and the concerned SQL Server instance is limited to 54 GB according to the max server memory (GB) server option. However, he noticed that SQL Server used 60 GB of memory which did not correspond to the configured max server memory option. What’s going on? Let’s investigate what is causing this memory overhead.
I admit to work mainly on SQL Server 2012 now because most of my customers have upgraded to this version and I had to revisit my skills about memory architecture with SQL Server 2008 R2. 🙂
Let’s start by the following question: Is it possible for SQL Server to consume more memory than a configured memory limit? For SQL Server versions older than 2012 the answer is yes and this is directly related to the memory architecture design. From this point on, we will talk exclusively about the SQL Server 2005 / 2008 versions. So, as you certainly know, SQL Server caps only the buffer pool memory area that mainly concerns the single page allocator mechanism.
Let’s have a little deep dive on SQL Server memory architecture here to understand where the single page allocator comes from. My goal is not to provide a complete explanation of the SQL Server memory management with SQLOS but just the concept to understand how to troubleshoot the issue presented in this article.
First of all, threads with SQL Server cannot directly interface with memory. They must go through memory allocators routines from a memory node that know which Windows APIs to use to honor a memory request. The memory node is a hidden component and provides a locality of allocation. Page allocators are one of the memory allocator types and most commonly used with the SQLOS memory manager because they allocate memory in multiple of SQLOS’s page – (payload = 8KB). Because memory node is a hidden component threads cannot use it directly and it must create a memory object that has its own memory clerk depending on its type.
A memory clerk is another component that provides data caching, memory control (in case of memory pressure for instance), memory usage statistics tracking capabilities and supports the same type of memory allocators than a memory node. There are several type of memory allocators like single page allocator that can only provide one page at the time, multipage allocator that provide a set of pages at time and others.
To summarize, when a request is asking memory to create a memory object, it goes to the concerned memory clerk which in turn requests the concerned memory allocator. Here a simple representation of memory allocation:
{Thread} -> {Memory object} –> {Memory Clerk} –> {Memory allocator in Memory Node}
The most interesting part here is that the buffer pool in SQL Server versions older than 2012 acts as both a memory clerk and a consumer. It means that it can provide single pages from others consumers and track its own memory consumption. You can read the detailed explainations in the excellent articles from Slava Oks here.
This is why we have only control of the buffer pool size by configuring the min. / max. server memory options because it provide single page allocations unlike other memory clerks with multi-page allocations. Note that SQL Server 2012 memory management is completely different and fortunately, we have a better control of the memory limitation with SQL Server.
So, now that we know exactly what is capped by the “max. server memory server” level option, let’s go back to my problem: Unfortunately I cannot reveal the real context of my customer here, but no problem: I am able to simulate the same problem.
In my scenario, I have a SQL Server 2008 R2 instance capped to 2560 MB and the total memory on my server is 8192MB. If I take a look at the task manager panel like my customer I can see that SQL Server uses more than my configured value MB:
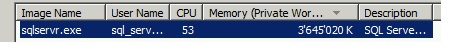
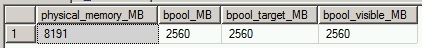
A quick math tells us that SQL Server is using 3.4 GB rather than 2.5 GB. Well, where then does the remaining part come from? If we take a look at the DMV sys.dm_os_sys_info, we can confirm that the buffer pool is capped to 2560MB as expected (single page allocations):
Go ahead and take a look at the multipage allocators statistics information related on memory clerks by using the DMV sys.dm_os_memory_clerks (remember that memory clerks have memory usage capabilities):
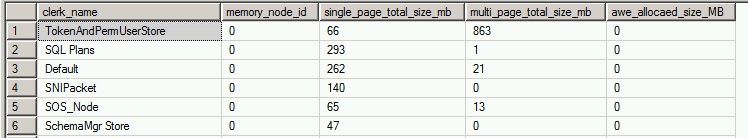
Note that in my case (same case as for my customer, but with a different order of magnitude), we have a particular memory clerk with a multipage allocator size greater than others. A quick math (2560 + 863 = 3423 MB) can confirm most part of the memory overhead in this case. So, at this point we can claim that SQL Server does not suffer from any memory leaks. This is a normal behavior ‘by design’.
Finally, let’s go back to the root cause of my customer that comes from the memory clerk related to the TokenAndPermUserStore cache that grows with time (approximatively 6GB of memory overhead). What exactly is the TokenAndPermUserStore cache?
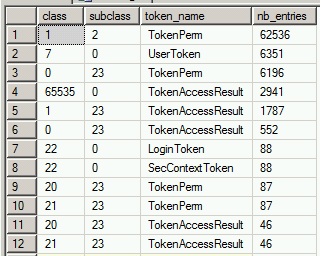
Well, this is a security cache that maintains the different security token types like LoginToken, TokenPerm, UserToken, SecContextToken, and TokenAccessResult generated when a user executes a query. The problem can occur when this cache store grows, the time to search for existing security entries to reuse increases, causing potentially slower query times because access to this cache is controlled by only one thread (please refer to the Microsoft KB 927396). In my demo we can also notice a lot of different entries related on the TokenAndPermUserStore cache by using the following query:
The situation above was very similar to my customer issue but we didn’t find any relevant related performance problems, only an important number of SQL Server logins and ad-hoc queries used by the concerned application.
The fix consisted of flushing entries from the TokenAndPermUserStore cache according to the workaround provided by Microsoft in the Microsoft KB 927396. I hope it will be a temporary solution, the time to investigate from the side of the application code, but this is another story!
However here the moral of my story: check carefully how SQL Server uses memory before saying that it suffers from memory leak 🙂
By David Barbarin
![Thumbnail [60x60]](https://www.dbi-services.com/blog/wp-content/uploads/2022/12/microsoft-square.png)
![Thumbnail [90x90]](https://www.dbi-services.com/blog/wp-content/uploads/2022/08/STH_web-min-scaled.jpg)
![Thumbnail [90x90]](https://www.dbi-services.com/blog/wp-content/uploads/2022/08/FRJ_web-min-scaled.jpg)
![Thumbnail [90x90]](https://www.dbi-services.com/blog/wp-content/uploads/2024/01/HME_web.jpg)