Within the past few days I was investigating another new feature of SQL Server 2025: OPTIMIZED_SP_EXECUTESQL. I was curious about the capabilities and the behaviour.
OPTIMIZED_SP_EXECUTESQL is a database scoped configuration which allows us to get rid of the overhead of compiling and producing execution plans when we deal with dynamic SQL. The first user-session which launches a given dynamic statement using the stored procedure “sp_executesql”, will have to wait until SQL Server goes through the compilation process and has produced an execution plan. Then, all the following user-sessions can benefit from the work which was done earlier in terms of no more compilation work is left to be done.
Without enabling this feature, SQL Server will produce an execution plan for each execution of the same dynamic query (means we lose time because SQL Server has to compile every time we execute a query) – even if the query text is exactly the same.
Furthermore, we are facing plan cache pollution because we have an unnecessarily large number of execution plans in the cache – for nothing! I will dig into a demo to show you the behaviour with and without this feature enabled. First of all, I create a tiny database called “OptimizedSpExecutesql”:
CREATE DATABASE [OptimizedSpExecutesql]
GO

USE [OptimizedSpExecutesql]
GO

CREATE TABLE dbo.Orders
(
OrderID INT IDENTITY(1,1) PRIMARY KEY,
OrderType Varchar(20),
OrderDate DATETIME DEFAULT GETDATE()
)
GO

INSERT INTO dbo.Orders (OrderType) VALUES
('Bentley'), ('Aston Martin'), ('Bentley'), ('Bugatti'),
('Lamborghini'), ('Bentley'), ('Aston Martin'), ('Chevrolet'),
('Bentley'), ('Bugatti'), ('Aston Martin'), ('Lamborghini');
GO
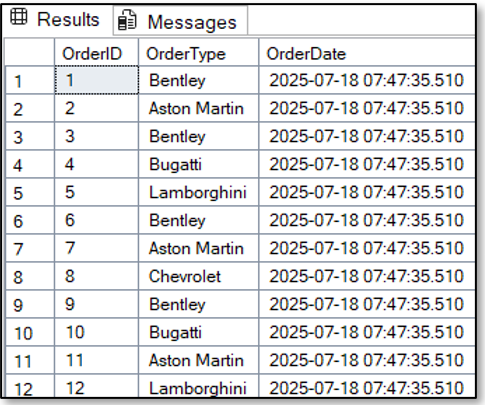
The result set looks as follows:
Now I check, if the feature is disable to simulate the “old” world (i.e. the old behaviour):
-- Turn off the features - just to be sure
ALTER DATABASE SCOPED CONFIGURATION SET OPTIMIZED_SP_EXECUTESQL = OFF;
GO
ALTER DATABASE SCOPED CONFIGURATION SET ASYNC_STATS_UPDATE_WAIT_AT_LOW_PRIORITY = OFF;
GO
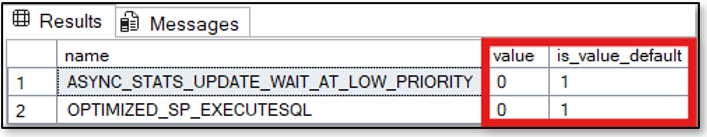
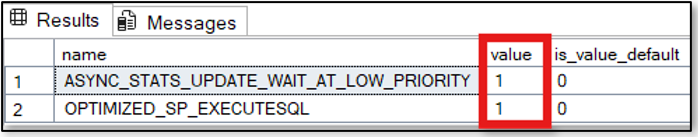
SELECT name, value, is_value_default FROM sys.database_scoped_configurations
WHERE name IN ('OPTIMIZED_SP_EXECUTESQL', 'ASYNC_STATS_UPDATE_WAIT_AT_LOW_PRIORITY')
GO
As you can see, this is the default value for both of the database scoped settings:
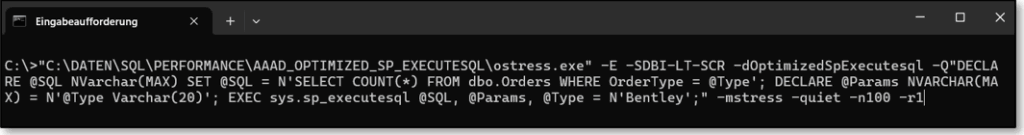
Let’s cleanup the cache first and then execute the TSQL-Statement shown below. I will execute the TSQL-Statement with “ostress.exe” to simulate 100 sessions executing the statement once per each session:
-- Clean the plan cache first
DBCC FREEPROCCACHE
GO

-- Define a parameterized query which will be executed via ostress.exe afterwards
-- This code below is just to mention the TSQL which will be executed
DECLARE @SQL NVarchar(MAX)
SET @SQL = N'SELECT COUNT(*) FROM dbo.Orders WHERE OrderType = @Type';

DECLARE @Params NVARCHAR(MAX) = N'@Type Varchar(20)';
EXEC sys.sp_executesql @SQL, @Params, @Type = N'Bentley';
GO
Here is the execution of the statement with “ostress.exe”:
And the output of the plan cache shows us, that SQL Server has produced several execution plans for the same sql_handle (i.e. the same statement):
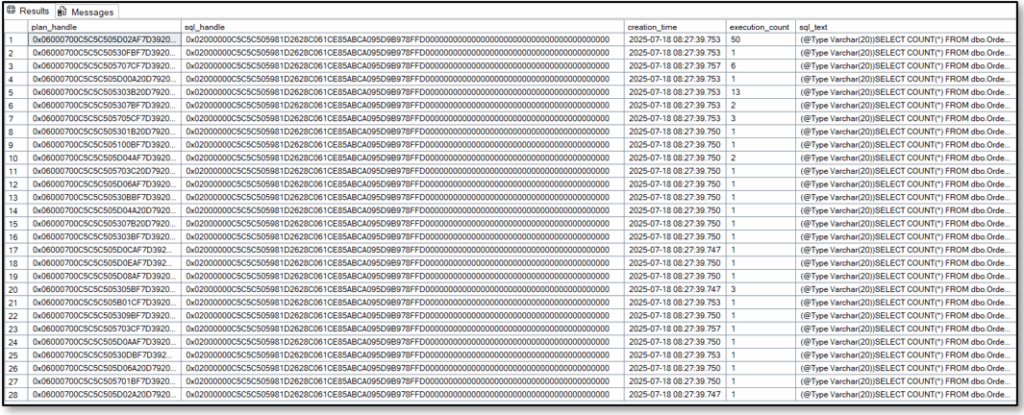
The result here is a little bit unpredictable – sometimes you get 10 different plans, sometimes 85 and so on and so forth.
But all executions have one thing in common: we end up with an enormous amount of execution plans cached within the plan cache for exactly the same – means one! – query…
The feature turned on
Now I want to show you the behaviour of SQL Server with the new feature turned on. Therefore, I will enable the database scoped setting(s) to on.
By-the-way: As you can see in the code section below, I turned on 2 switches at the same time. The first one is the feature itself which helps us to reduce compiling to a minimum while the second one just helps us to refresh the statistics asynchronously at low priority (instead of doing blockings through a synchronous SCH-M lock) – means that Statistic Updates stalls are avoided because SQL Server will use current statistics and updates those later if he isn’t able to get a SCH-M lock placed at the moment.
-- Change the behaviour having the feature turned on
USE [OptimizedSpExecutesql]
GO

ALTER DATABASE SCOPED CONFIGURATION SET OPTIMIZED_SP_EXECUTESQL = ON;
GO
ALTER DATABASE SCOPED CONFIGURATION SET ASYNC_STATS_UPDATE_WAIT_AT_LOW_PRIORITY = ON;
GO

SELECT name, value, is_value_default FROM sys.database_scoped_configurations
WHERE name IN ('OPTIMIZED_SP_EXECUTESQL', 'ASYNC_STATS_UPDATE_WAIT_AT_LOW_PRIORITY')
GO
After clearing the cache and executing the TSQL-Statement via “ostress.exe” again, we see within the plan cache following content:

One plan with an execution count of 100 – as expected and also as desired!
Get a deeper insight into what is going on behind the scenes
I want to show you what is captured within an Extended Events Session when we execute the same query as above – once without the new feature and once with it.
The Extended Events Session looks as follows:
CREATE EVENT SESSION [QueryPerformanceCapture] ON SERVER
ADD EVENT sqlserver.sql_batch_completed (
ACTION (sqlos.task_time, sqlserver.client_app_name, sqlserver.database_id, sqlserver.server_principal_name, sqlserver.session_id, sqlserver.sql_text)
WHERE ([sqlserver].[sql_text] LIKE N'%WHERE OrderType = @Type%')),
ADD EVENT sqlserver.sql_statement_recompile (
ACTION (sqlserver.client_app_name, sqlserver.database_id, sqlserver.session_id, sqlserver.sql_text)
WHERE ([sqlserver].[sql_text] LIKE N'%WHERE OrderType = @Type%')),
ADD EVENT sqlserver.sp_statement_completed (
ACTION (sqlserver.session_id, sqlserver.sql_text, sqlserver.client_app_name, sqlserver.database_id)
WHERE ([sqlserver].[sql_text] LIKE N'%WHERE OrderType = @Type%')),
ADD EVENT sqlserver.query_post_compilation_showplan(
ACTION(sqlserver.sql_text, sqlserver.session_id, sqlserver.client_app_name, sqlserver.database_id)
WHERE ([sqlserver].[sql_text] LIKE N'%WHERE OrderType = @Type%'))
ADD TARGET package0.event_file (
SET filename = N'C:\DATEN\SQL\SQL_SERVER_HOME\MSSQL17.MSSQLSERVER\ANALYSIS\QueryPerformanceCapture.xel', max_file_size = (10), max_rollover_files = (5))
WITH (
    MAX_MEMORY = 4096 KB,
    EVENT_RETENTION_MODE = ALLOW_SINGLE_EVENT_LOSS,
    MAX_DISPATCH_LATENCY = 30 SECONDS,
    MAX_EVENT_SIZE = 0 KB,
    MEMORY_PARTITION_MODE = NONE,
    TRACK_CAUSALITY = OFF,
    STARTUP_STATE = ON
);
GO

-- Start the event session
ALTER EVENT SESSION [QueryPerformanceCapture] ON SERVER
STATE = START;
GO
As you can see, during the first execution of the TSQL-Statement via “ostress.exe”, 100 events were captured in terms of completion (because we launched 100 executions of the code) and 47 events related to compilations:
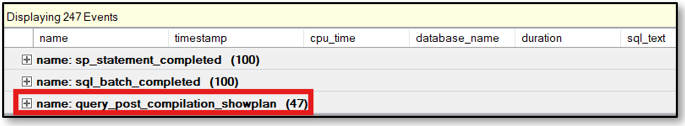
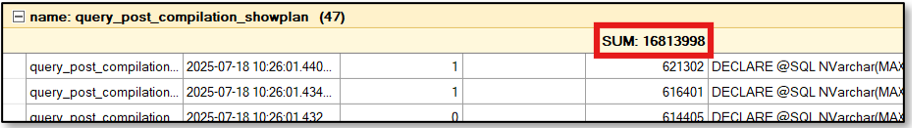
Regarding the time spent on those 47 compile events, we land in this example on 16813998 nanoseconds which is 16.8 seconds:
As soon as I turned on the feature on database level, we are facing only 1 event related to compilation:
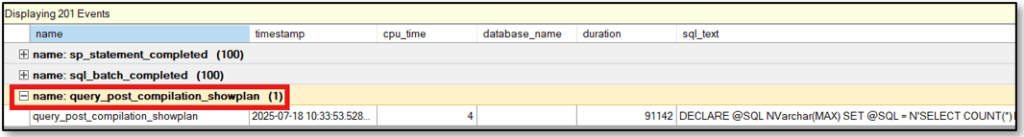
Regarding the time spent here on compiling now, we observe that this is 91142 nanoseconds (i.e. only 0.09 seconds) because SQL Server had to do the work only once:

Conclusion
From my point of view, “OPTIMIZED_SP_EXECUTESQL” is as well as “Optimized Locking” a real game changer. Or should I say: could be?
Well, it depends as always… It depends on the workload you are dealing with on your SQL Server or database. If you see a lot of dynamic SQL, enabling this feature is really valuable otherwise it won’t have an effect. Therefore, I recommend to enable this feature not instantaneous on all your databases, but to monitor your workload first and then make your decision after evaluating.
![Thumbnail [60x60]](https://www.dbi-services.com/blog/wp-content/uploads/2023/09/SGR_web-2.jpg)
![Thumbnail [90x90]](https://www.dbi-services.com/blog/wp-content/uploads/2022/08/NAC_web-min-scaled.jpg)
![Thumbnail [90x90]](https://www.dbi-services.com/blog/wp-content/uploads/2022/08/DWE_web-min-scaled.jpg)