

During my tests of the SQL Server 20126 CTP2, I noticed an additional icon on SQL Server Management studio which is close to the Actual Execution Plan button as shown below:

I decided to take a look at the SQL Server 2016 BOL and I found a topic about this feature. It seems to be a funny feature. So after that, I decided to test it with one of my financial query (developed for one of my customer) which usually takes a long time to run.
Let’s go ahead and after running my long query, this first test was in fact inconclusive because after opening a new tab, I got stuck with the following message even after stopping my query execution:

Maybe my query is too complex and I have to investigate in a near future. Updated 04.06.2015: It seems that it is a bug with this current release of SQL Server 2016 (CTP2). So I will try later with maybe, the next CTP.
Let’s continue by cutting out my big query into smaller pieces of code and the test ran successfully this time. Indeed, I was able to see a “progressive” query plan where we can see how long operators are taking as well as how far they are in their operations with some awesome animation.
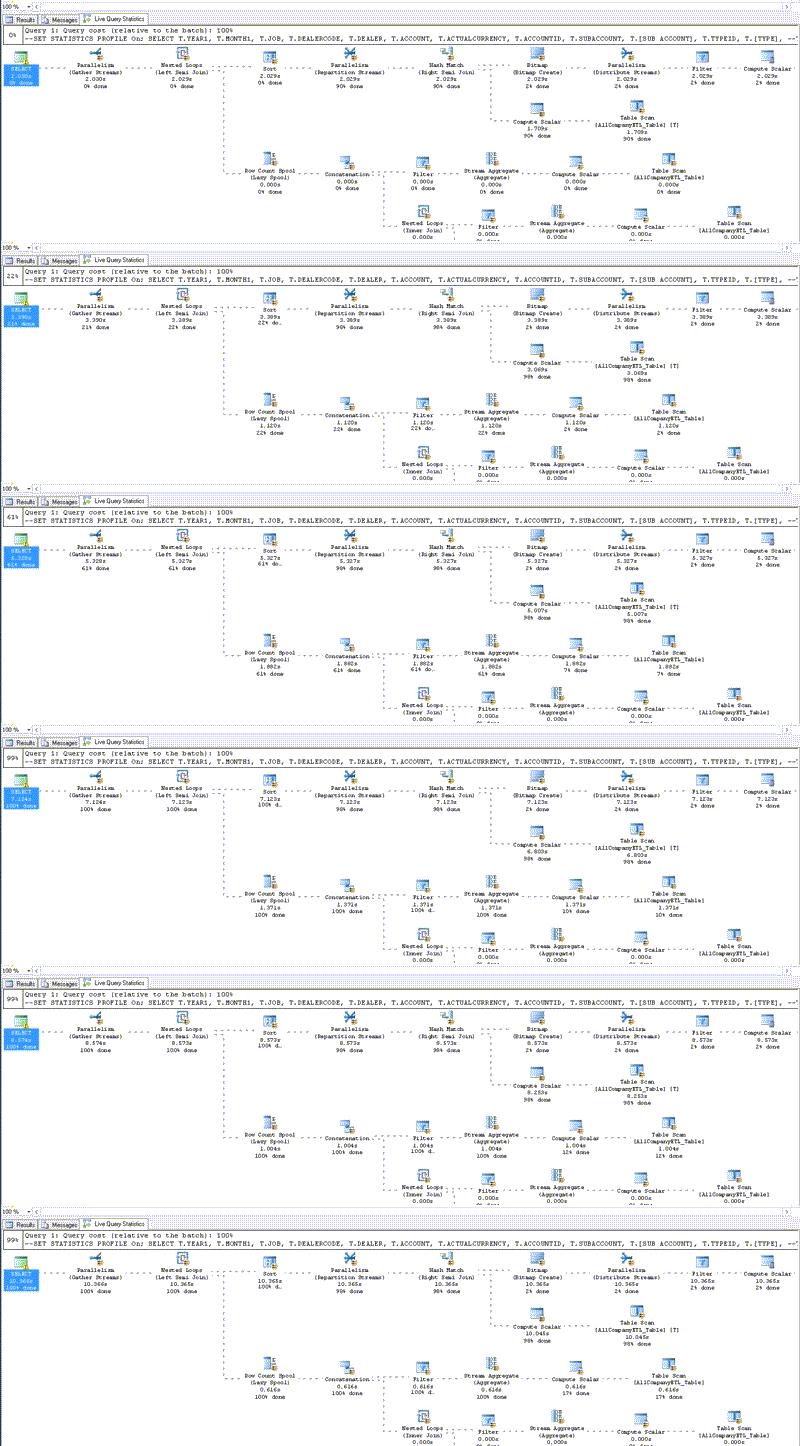
Basically, we get an “enhanced” execution plan tree. The dotted lines point out the operations in progress with some additional information as the current duration for each operator. Likewise, we may retrieve all other usual information that concern a query execution plan.
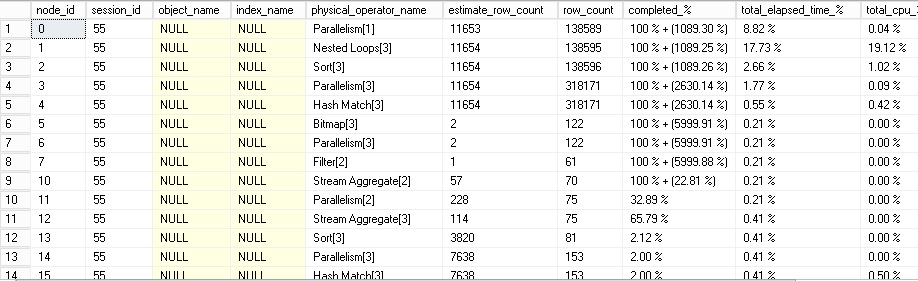
However, I noticed during my tests that the percentage calculation didn’t work on the operators if the row estimate is not correct (it will get stuck on 100% while the time keeps ticking away). At this point, I remembered that I faced the same problem with the DMV sys.dm_exec_query_profiles introduced by SQL Server 2014 (please take a look at my blog post here). Let’s perform the same test by using the sys.dm_exec_query_profiles DMV and as excepted I noticed the same duration issue when cardinality estimation was wrong.
I guess we will learn better in the future about this interesting feature. We’re certainly on the good way in order to detect expensive operations just by looking at the pretty cool animation!
By David Barbarin