In today’s data-driven world, monitoring and visualizing the health and performance of your database clusters is a must. With tools like Prometheus and Grafana, you can gain valuable insights into your PostgreSQL Patroni setup, ensuring its smooth operation and proactive maintenance. In this guide, we’ll walk you through the steps of installing and configuring Prometheus and Grafana to monitor your PostgreSQL Patroni cluster effectively.
Existing Setup
Before we dive into installation, let’s take a quick look at my existing setup. I have a Patroni cluster composed of three openSUSE 15.5 servers with etcd version 3.5.13. Two nodes are running with PostgreSQL instances, version 16.2, and Patroni version 3.3.0. All binaries are stored in /u01 and data in /u02.
The setup of Prometheus and Grafana will be made from the first node of my cluster, patroni1 (192.168.56.125).
postgres@patroni1:/home/postgres [pg162] patronictl list
+ Cluster: joan-cluster (7360609570873002877) ----+----+-----------+
| Member   | Host           | Role    | State     | TL | Lag in MB |
+----------+----------------+---------+-----------+----+-----------+
| patroni1 | 192.168.56.125 | Leader  | running   |  1 |           |
| patroni2 | 192.168.56.126 | Replica | streaming |  1 |         0 |
+----------+----------------+---------+-----------+----+-----------+

postgres=# select version();
                                                version                               >
-------------------------------------------------------------------------------------------->
 PostgreSQL 16.2 dbi services build on x86_64-pc-linux-gnu, compiled by gcc (SUSE Linux) 7.5>
(1 row)
1. Installing Prometheus
1.1. Download Prometheus
Grab the latest release from the official website or use wget:
wget https://github.com/prometheus/prometheus/releases/download/v2.51.2/prometheus-2.51.2.linux-amd64.tar.gz1.2. Extract and Move Files
Extract the downloaded file and move it to the desired location:
tar xzf prometheus-2.51.2.linux-amd64.tar.gz
mv prometheus-2.51.2.linux-amd64 /u01/app/postgres/product/
rm prometheus-2.51.2.linux-amd64.tar.gz
1.3. Create Configuration File
Create or edit the prometheus.yml file to define scrape configurations:
postgres@patroni1:/home/postgres/ [pg162] vi /u01/app/postgres/product/prometheus-2.51.2.linux-amd64/prometheus.yml

postgres@patroni1:/home/postgres/ [pg162] cat /u01/app/postgres/product/prometheus-2.51.2.linux-amd64/prometheus.yml
# my global config
global:
  scrape_interval:     15s # Set the scrape interval to every 15 seconds. Default is every 1 minute.
  evaluation_interval: 15s # Evaluate rules every 15 seconds. The default is every 1 minute.
  # scrape_timeout is set to the global default (10s).

# Alertmanager configuration
alerting:
  alertmanagers:
  - static_configs:
    - targets:
      # - alertmanager:9093

# Load rules once and periodically evaluate them according to the global 'evaluation_interval'.
rule_files:
  # - "first_rules.yml"
  # - "second_rules.yml"

# A scrape configuration containing exactly one endpoint to scrape:
# Here it's Prometheus itself.
scrape_configs:
  - job_name: 'prometheus'
    static_configs:
    - targets: ['192.168.56.125:9090']

  - job_name: 'postgres_exporter_PG1'
    metrics_path: '/metricsRestart=always'
    static_configs:
    - targets: ['192.168.56.125:9187']

  - job_name: 'patroni'
    metrics_path: '/metrics'
    static_configs:
    - targets: ['192.168.56.125:8008']
In this case, we are only going to monitor the PostgreSQL instance on the server 192.168.56.125 but you could also modify Prometheus configuration and integrate the PostgreSQL exporter for the server 192.168.56.126.
1.4. Create Prometheus Service File
Define a systemd service for Prometheus:
postgres@patroni1:/home/postgres/ [pg162] sudo vi /etc/systemd/system/prometheus.service

postgres@patroni1:/home/postgres/ [pg162] cat /etc/systemd/system/prometheus.service
[Unit]
Description=Prometheus Server
Documentation=https://prometheus.io/docs/introduction/overview/
After=network-online.target

[Service]
User=postgres
Restart=on-failure
#Type=simple
ExecStart=/u01/app/postgres/product/prometheus-2.51.2.linux-amd64/prometheus --storage.tsdb.path=/u02/pgdata/prometheus/ --web.external-url=http://192.168.56.125:9090 --config.file=/u01/app/postgres/product/prometheus-2.51.2.linux-amd64/prometheus.yml
Restart=always
RestartSec=10s
LimitNOFILE=40000
KillMode=process

[Install]
WantedBy=multi-user.target
1.5. Start and Check Prometheus Service
Don’t forget to open port 9090 if your firewall is enable.
sudo systemctl daemon-reload
sudo systemctl enable --now prometheus.service
sudo systemctl status prometheus.service
Go to the URL: http://192.168.56.125:9090/
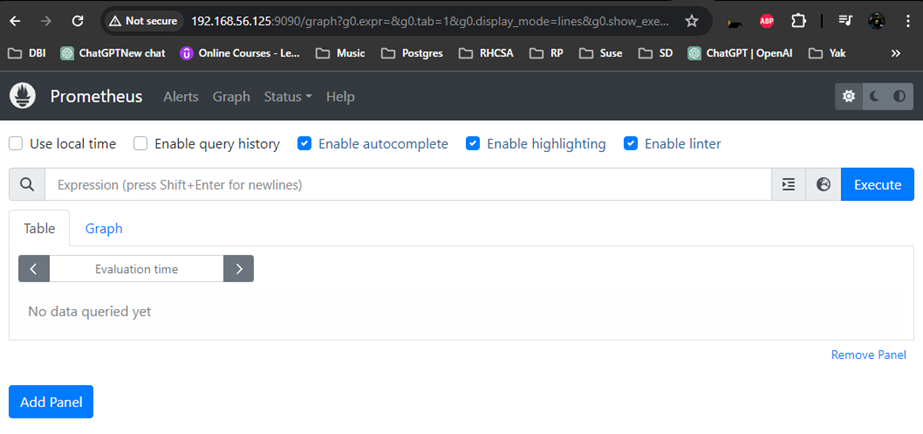
In the appbar, click on the menu Status and then Targets
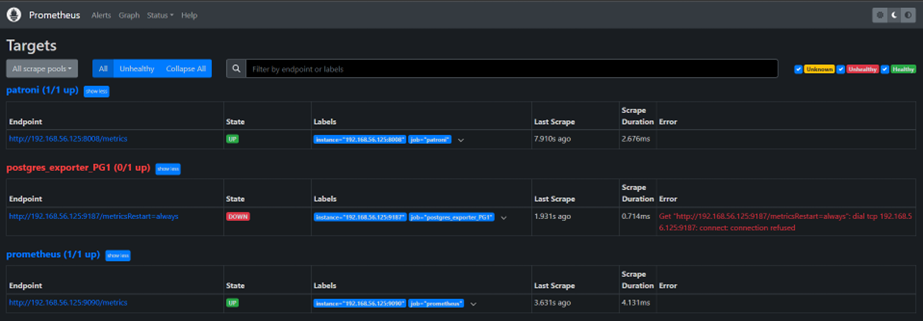
We have an alert because we still need to setup postgres_exporter, but this is normal, so here comes the next step.
2. Integration of PostgreSQL Exporter
The PostgreSQL Exporter allows us to gather PostgreSQL metrics for Prometheus. It’s developed by the Prometheus community and available on their github: https://github.com/prometheus-community/postgres_exporter.
2.1. Download PostgreSQL Exporter
postgres@patroni1:/home/postgres/ [pg162] wget https://github.com/prometheus-community/postgres_exporter/releases/download/v0.15.0/postgres_exporter-0.15.0.linux-amd64.tar.gz
postgres@patroni1:/home/postgres/ [pg162] tar xvf postgres_exporter-0.15.0.linux-amd64.tar.gz
postgres@patroni1:/home/postgres/ [pg162] mv postgres_exporter-0.15.0.linux-amd64 /u01/app/postgres/product/
postgres@patroni1:/home/postgres/ [pg162] rm postgres_exporter-0.15.0.linux-amd64.tar.gz
2.2. Create Service File
Define a systemd service for the PostgreSQL Exporter:
postgres@patroni1:/home/postgres/ [pg162] sudo vi /etc/systemd/system/postgres-exporter-pg1.service
postgres@patroni1:/home/postgres/ [pg162] sudo cat /etc/systemd/system/postgres-exporter-pg1.service
[Unit]
Description=Prometheus exporter for Postgresql
Wants=network-online.target
After=network-online.target

[Service]
User=postgres
Group=postgres
WorkingDirectory=/u01/app/postgres/product/postgres_exporter-0.15.0.linux-amd64
EnvironmentFile=/u01/app/postgres/product/postgres_exporter-0.15.0.linux-amd64/postgres-exporter-PG1.env
ExecStart=/u01/app/postgres/product/postgres_exporter-0.15.0.linux-amd64/ --web.listen-address=:9187 --web.telemetry-path=/metricsRestart=always

[Install]
WantedBy=multi-user.target
Create the necessary env file and open the necessary firewall port:
postgres@patroni1:/home/postgres/ [pg162] sudo vi /u01/app/postgres/product/postgres_exporter-0.15.0.linux-amd64/postgres-exporter-PG1.env
postgres@patroni1:/home/postgres/ [pg162] sudo cat /u01/app/postgres/product/postgres_exporter-0.15.0.linux-amd64/postgres-exporter-PG1.env
DATA_SOURCE_NAME="postgresql://postgres:[email protected]:5432/?sslmode=disable"

postgres@patroni1:/home/postgres/ [pg162] sudo firewall-cmd --zone=public --add-port=9187/tcp --permanent
postgres@patroni1:/home/postgres/ [pg162] sudo firewall-cmd --reload
2.3. Start Service and Check Targets
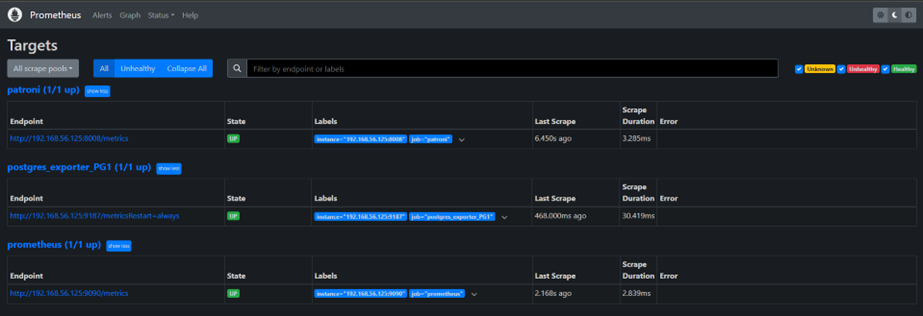
sudo systemctl enable postgres-exporter-pg1.service
sudo systemctl start postgres-exporter-pg1.service
The error has now disappeared and Prometheus is able to collect metrics for PostgreSQL.
It’s time to put in lights our metrics thanks to some Graphs, let’s install Grafana.
3. Installing and Configuring Grafana
3.1. Download
Download Grafana:
postgres@patroni1:/home/postgres/ [pg162] wget https://dl.grafana.com/oss/release/grafana-10.4.2.linux-amd64.tar.gz
postgres@patroni1:/home/postgres/ [pg162] tar -zxvf grafana-10.4.2.linux-amd64.tar.gz
postgres@patroni1:/home/postgres/ [pg162] mv grafana-10.4.2.linux-amd64 /u01/app/postgres/product/
postgres@patroni1:/home/postgres/ [pg162] rm grafana-10.4.2.linux-amd64.tar.gz
3.2. Create Service File:
Define a systemd service for Grafana:
15:45:16 postgres@patroni1:/home/postgres/ [pg162] sudo vi /etc/systemd/system/grafana.service
15:45:16 postgres@patroni1:/home/postgres/ [pg162] sudo cat /etc/systemd/system/grafana.service
[Unit]
Description=Grafana Server
After=prometheus.service

[Service]
User=postgres
Restart=on-failure
WorkingDirectory=/u01/app/postgres/product/grafana-10.4.2.linux-amd64/
#Type=simple
ExecStart=/u01/app/postgres/product/grafana-10.4.2.linux-amd64/bin/grafana-server
Restart=always
RestartSec=10s
LimitNOFILE=40000
KillMode=process

[Install]
WantedBy=multi-user.target
3.3. Start and Access Grafana
You can now start Grafana but don’t forget to open the necessary firewall port:
sudo firewall-cmd --zone=public --add-port=3000/tcp --permanent
sudo firewall-cmd --reload
sudo systemctl daemon-reload
sudo systemctl enable grafana.service
sudo systemctl start grafana.service
You can access Grafana via the URL: http://192.168.56.125:3000/
On the first prompt, you will be asked for a user name and password, you can use Username: admin, Password: admin.
3.4. Add a data source
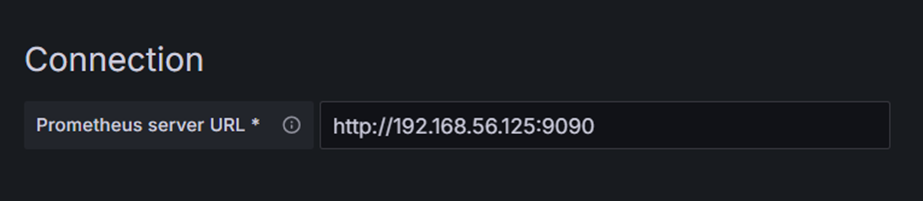
Before to import a Dashboard, you first have to add a data source. Go to Home > Connections > Data sources and click Add data source.
Select Prometheus and then change the Prometheus server URL
3.5. Import your first Dashboard
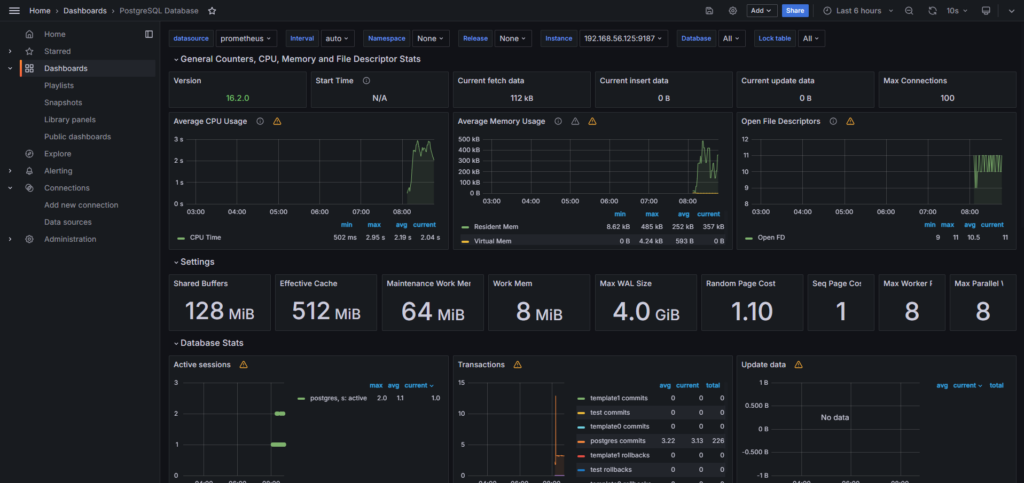
In the Dashboard page, click on the New menu and select import. You can import your first PostgreSQL dashboard thanks to the ID 9628, that will use the PostgreSQL exporter to monitor our leader instance. On the next screen, be sure to select the data source we just created, prometheus.
You can now access your first Grafana dashboard 😄
3.6. Import a dashboard to monitor Patroni
Patroni provides a REST API accessible with the port 8008 by default. It allows us to request and collect information related to Patroni cluster and nodes status (https://patroni.readthedocs.io/en/latest/rest_api.html).
As we configured Prometheus to have access to this API, we are now able to use it in Grafana to create some Dashboard.
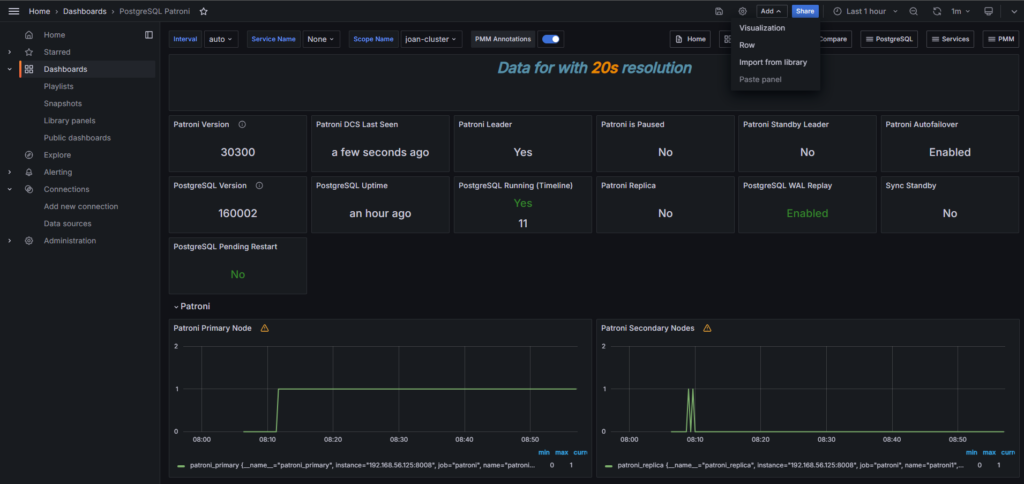
I found a blog on the Percona website that provides an ID to import a Patroni Dashboard (https://www.percona.com/blog/monitoring-a-postgresql-patroni-cluster/), 18870. Thanks a lot to the author !
Though this dashboard is made to work with a service from pmm, it still works with our setup ! In my case, I edited some of the tiles and even add one to know if Patroni is paused or not.
It’s now your turn to create and edit nice dashboard, as per your needs. Even without a lot of knowledge on Grafana, it is quite easy to create nice and useful dashboards, and that is what I like.
4. Conclusion
With Prometheus for data collection, PostgreSQL Exporter and Patroni API for metrics extraction, and Grafana for visualization, you now have a comprehensive monitoring setup for your PostgreSQL Patroni cluster. By utilizing these tools effectively, you can ensure the stability, performance, and health of your database environment. Happy monitoring! 😄
![Thumbnail [60x60]](https://www.dbi-services.com/blog/wp-content/uploads/2022/08/FRJ_web-min-scaled.jpg)
![Thumbnail [90x90]](https://www.dbi-services.com/blog/wp-content/uploads/2022/08/DWE_web-min-scaled.jpg)