By Franck Pachot
.
On the Oracle Database Appliance, the redo logs are on Flash storage (and with X6 everything is on Flash storage) so you may wonder if we can benefit from 4k redo blocksize. Here are some tests about it on an ODA X6-2M.
I’ll compare the same workload (heavy inserts) with 512 bytes and 4k bytes block size redo. However, we can’t create a log group different than 512 bytes:
ORA-01378: The logical block size (4096) of file
/u03/app/oracle/redo/LABDB1/onlinelog/o1_mf_999_%u_.log is not compatible with
the disk sector size (media sector size is 512 and host sector size is 512)
This is because the flash storage is exposed with 512 bytes sector size:
ASMCMD> lsdg
State    Type    Rebal  Sector  Block       AU  Total_MB  Free_MB  Req_mir_free_MB  Usable_file_MB  Offline_disks  Voting_files  Name
MOUNTED  NORMAL  N         512   4096  4194304   4894016  4500068          2441888         1023992              0             Y  DATA/
MOUNTED  NORMAL  N         512   4096  4194304   1231176   221172           610468         -199762              0             N  RECO/
Then, in order to be able to create new redo log groups with higher block size you need to set “_disk_sector_size_override” to TRUE;
I have 3 log groups with 512 bytes block size, and 3 groups with 4k:
LOGFILE
  GROUP 10 '+RECO/LABDB1/ONLINELOG/group_10.264.917867333'  SIZE 51200M BLOCKSIZE 512,
  GROUP 11 '+RECO/LABDB1/ONLINELOG/group_11.265.917867489'  SIZE 51200M BLOCKSIZE 512,
  GROUP 12 '+RECO/LABDB1/ONLINELOG/group_12.266.917867645'  SIZE 51200M BLOCKSIZE 512,
  GROUP 13 '+RECO/LABDB1/ONLINELOG/group_13.267.917867795'  SIZE 51200M BLOCKSIZE 4096,
  GROUP 14 '+RECO/LABDB1/ONLINELOG/group_14.268.917867913'  SIZE 51200M BLOCKSIZE 4096,
  GROUP 15 '+RECO/LABDB1/ONLINELOG/group_15.269.917868013'  SIZE 51200M BLOCKSIZE 4096
In 12c the database files should be on ACFS and not directly on the diskgroup. We did this on purpose in order to check if there is any overhead when in ACFS and we have seen exactly the same performance in both. There is something I dislike here however: redo log files are not multiplexed with multiple log members, but rely on the diskgroup redundancy. I agree with that in ASM because you are not supposed to manage the files and then risk to delete one of them. But in ACFS you see only one file, and if you drop it by mistake, both mirrors are lost, with the latest transactions.
On an insert intensive workload I take AWR snapshots between two log switches:
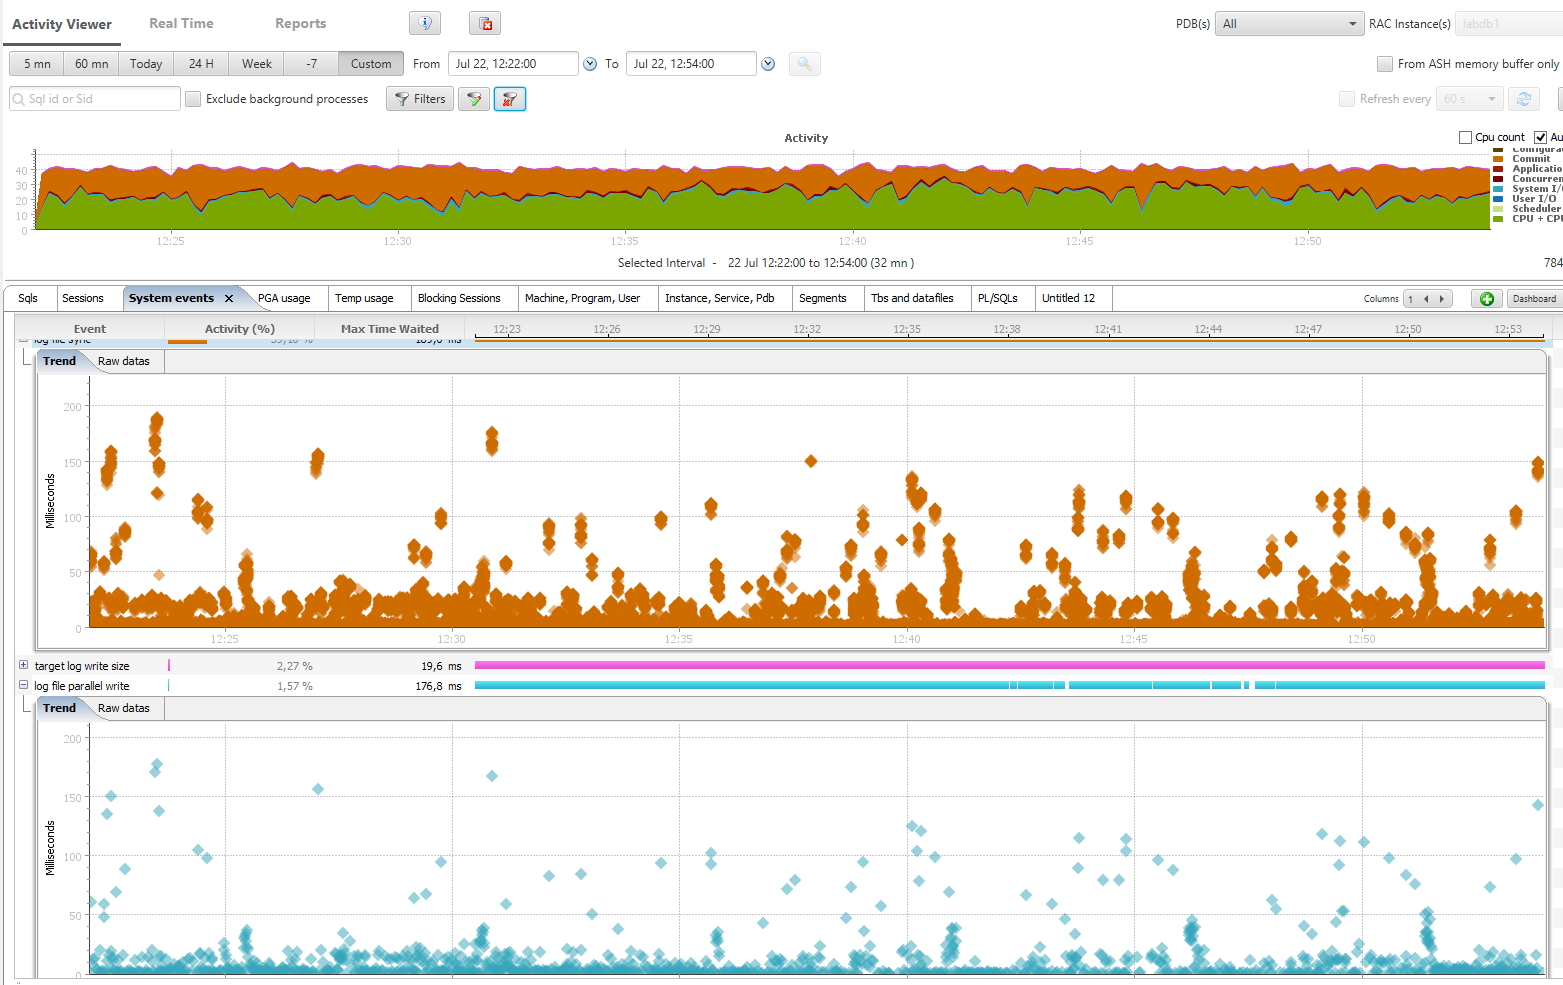
The switch between blocksize 512 and blocksize 4096 happened at 12:35
Don’t be nervous about those orange ‘log file sync waits’ we had to run 10000 transactions per second in order to get some contention here.
We have to go to the details in order to compare, from an AWR Diff report:
Workload Comparison
~~~~~~~~~~~~~~~~~~~                      1st Per Sec          2nd Per Sec      %Diff
                                     ---------------      ---------------     ------
                       DB time:                 37.9                 37.3       -1.4
                      CPU time:                 19.0                 24.4       28.4
           Background CPU time:                  0.8                  1.0       23.2
             Redo size (bytes):         61,829,138.5         76,420,493.9       23.6
         Logical read (blocks):          1,181,178.7          1,458,915.9       23.5
                 Block changes:            360,883.0            445,770.8       23.5
        Physical read (blocks):                  0.4                  1.1      164.3
       Physical write (blocks):             14,451.2             16,092.4       11.4
              Read IO requests:                  0.4                  1.1      164.3
             Write IO requests:              9,829.4             10,352.3        5.3
                  Read IO (MB):                  0.0                  0.0      100.0
                 Write IO (MB):                112.9                125.7       11.4
                  IM scan rows:                  0.0                  0.0        0.0
       Session Logical Read IM:
                    User calls:              8,376.0             10,341.2       23.5
                  Parses (SQL):              5,056.0              6,247.8       23.6
             Hard parses (SQL):                  0.0                  0.0        0.0
            SQL Work Area (MB):                  3.1                  3.2        3.5
                        Logons:                  0.4                  0.3      -37.2
                Executes (SQL):            225,554.2            278,329.3       23.4
                  Transactions:             10,911.0             13,486.4       23.6
The second workload, when redo blocksize was 4k, was able to handle 23% more activity.
‘log file sync’ average time is 1.3 milliseconds instead of 2.4:
Top Timed Events   First DB/Inst: LABDB1/labdb1 Snaps: 155-156 (Elapsed time: 301.556 sec  DB time: 11417.12 sec),  Second DB/Inst: LABDB1/labdb1 Snaps: 157-158 (Elapsed time: 301.927 sec  DB time: 11269.1 sec)
-> Events with a "-" did not make the Top list in this set of snapshots, but are displayed for comparison purposes

                                               1st                                                                                                2nd
------------------------------------------------------------------------------------------------   ------------------------------------------------------------------------------------------------
Event                          Wait Class           Waits      Time(s)  Avg Time(ms)    %DB time   Event                          Wait Class           Waits      Time(s)  Avg Time(ms)    %DB time
------------------------------ ------------- ------------ ------------ ------------- -----------   ------------------------------ ------------- ------------ ------------ ------------- -----------
 CPU time                                             N/A      5,722.8           N/A        50.1    CPU time                                             N/A      7,358.4           N/A        65.3
 log file sync                 Commit           2,288,655      5,412.1           2.4        47.4    log file sync                 Commit           2,808,036      3,535.5           1.3        31.4
 target log write size         Other              363,206        283.7           0.8         2.5    target log write size         Other              644,287        278.2           0.4         2.5
 log file parallel write       System I/O         368,063        225.1           0.6         2.0    enq: TX - row lock contention Application        171,485        170.2           1.0         1.5
 db file parallel write        System I/O          12,399        160.2          12.9         1.4    db file parallel write        System I/O          12,131        150.4          12.4         1.3
 enq: TX - row lock contention Application        144,822        133.2           0.9         1.2    log file parallel write       System I/O         649,501        148.1           0.2         1.3
 library cache: mutex X        Concurrency        130,800        120.8           0.9         1.1    library cache: mutex X        Concurrency         86,632        128.1           1.5         1.1
 log file sequential read      System I/O           7,433         27.5           3.7         0.2    LGWR wait for redo copy       Other              478,350         45.1           0.1         0.4
 LGWR wait for redo copy       Other              228,643         20.8           0.1         0.2    log file sequential read      System I/O           6,577         21.7           3.3         0.2
 buffer busy waits             Concurrency        261,348         15.8           0.1         0.1    buffer busy waits             Concurrency        295,880         20.1           0.1         0.2
                          --------------------------------------------------------------------------------------------------------------------
We see that this difference comes from lower latency in ‘log file parallel write’:
Wait Events   First DB/Inst: LABDB1/labdb1 Snaps: 155-156 (Elapsed time: 301.556 sec  DB time: 11417.12 sec),  Second DB/Inst: LABDB1/labdb1 Snaps: 157-158 (Elapsed time: 301.927 sec  DB time: 11269.1 sec)
-> Ordered by absolute value of  'Diff' column of '% of DB time' descending (idle events last)

                                                      # Waits/sec (Elapsed Time)                    Total Wait Time (sec)                         Avg Wait Time (ms)
                                               ----------------------------------------   ----------------------------------------   -------------------------------------------
Event                          Wait Class                 1st            2nd      %Diff              1st            2nd      %Diff               1st             2nd       %Diff
------------------------------ -------------   -------------- -------------- ----------   -------------- -------------- ----------   --------------- --------------- -----------
log file sync                  Commit                 7,589.5        9,300.4       22.5          5,412.1        3,535.5      -34.7              2.36            1.26      -46.61
log file parallel write        System I/O             1,220.5        2,151.2       76.2            225.1          148.1      -34.2              0.61            0.23      -62.30
enq: TX - row lock contention  Application              480.2          568.0       18.3            133.2          170.2       27.8              0.92            0.99        7.61
LGWR wait for redo copy        Other                    758.2        1,584.3      109.0             20.8           45.1      117.1              0.09            0.09        0.00
library cache: mutex X         Concurrency              433.8          286.9      -33.8            120.8          128.1        6.0              0.92            1.48       60.87
db file parallel write         System I/O                41.1           40.2       -2.3            160.2          150.4       -6.2             12.92           12.40       -4.02
cursor: pin S                  Concurrency               29.7           46.0       55.0              9.9           16.6       67.0              1.11            1.19        7.21
cursor: mutex X                Concurrency                7.0           10.8       54.2             13.6           19.7       45.0              6.39            6.01       -5.95
latch: In memory undo latch    Concurrency              585.3          749.0       28.0             10.8           16.3       50.8              0.06            0.07       16.67
In order to go into details, here is the wait event histogram for 512 bytes redo blocksize:
                                                    % of Waits
                                 -----------------------------------------------
                           Total
Event                      Waits  <1ms  <2ms  <4ms  <8ms <16ms <32ms  1s
------------------------- ------ ----- ----- ----- ----- ----- ----- ----- -----
LGWR all worker groups        41  48.8  12.2  14.6  14.6   4.9   2.4   2.4
LGWR any worker group        259   6.2   5.4   8.9  13.9  18.1  18.1  29.3
LGWR wait for redo copy   228.9K  99.1    .9    .0
LGWR worker group orderin    442  44.6   9.7   4.5   5.0   9.3  10.6  16.3
log file parallel write   368.5K  85.3   7.5   4.7   1.4    .9    .2    .0
log file sequential read    7358   6.5  13.1  59.0  17.2   3.0   1.1    .2
log file sync               2.3M  48.9  23.1  17.0   5.7   2.7   2.3    .3
and for 4096 bytes blocksize:
                                                    % of Waits
                                 -----------------------------------------------
                           Total
Event                      Waits  <1ms  <2ms  <4ms  <8ms <16ms <32ms  1s
------------------------- ------ ----- ----- ----- ----- ----- ----- ----- -----
LGWR all worker groups        20  45.0   5.0        15.0  10.0   5.0  20.0
LGWR any worker group        235   7.2   3.0   5.5   7.7  14.5  25.1  37.0
LGWR wait for redo copy   478.7K  98.9   1.0    .1    .0
LGWR worker group orderin    517  51.3   9.7   2.3   2.9   7.2  11.6  15.1
log file parallel write   649.9K  97.7   1.3    .3    .3    .4    .0    .0
log file sequential read    6464   5.7   8.2  73.5  11.0   1.2    .3    .1
log file sync               2.8M  78.2  15.6   2.3    .8   1.6   1.2    .
Few milliseconds are not perceived by end-user at commit except if the application has a design that is so bad that hundreds of commits are done for each user interaction. Even if both are really fast, the log writers was above 1ms for writes only for 1% of them when in blocksize 4k vs. 15% with default blocksize.
This faster latency is measured by I/O statistics as well:
                 Reads:  Reqs    Data   Writes:  Reqs    Data    Waits:   Avg
Function Name      Data per sec per sec    Data per sec per sec   Count  Tm(ms)
--------------- ------- ------- ------- ------- ------- ------- ------- -------
BLOCKSIZE 512:
LGWR 0M 0.0 0M 18.1G 2420.4 61.528M 368.9K 0.6BLOCKSIZE 4096:
LGWR 0M 0.0 0M 24.1G 4263.5 81.689M 649.5K 0.2To be comprehensive, here are the statistics related with redo, thanks to those many statistics available in 12c:
                                                   Value                             per Second (Elapsed Time)
                                 -------------------------------------------   ---------------------------------------
Statistic                                     1st              2nd     %Diff              1st            2nd     %Diff
------------------------------   ---------------- ---------------- ---------   -------------- -------------- ---------

redo KB read                           16,319,609       15,783,576      -3.3         54,118.0       52,276.1      -3.4
redo blocks checksummed by FG          26,587,090        1,000,267     -96.2         88,166.3        3,312.9     -96.2
redo blocks written                    37,974,499        6,318,372     -83.4        125,928.5       20,926.8     -83.4
redo blocks written (group 0)          37,256,502        6,257,861     -83.2        123,547.5       20,726.4     -83.2
redo blocks written (group 1)             717,997           60,511     -91.6          2,381.0          200.4     -91.6
redo entries                           24,023,503       30,214,386      25.8         79,665.1      100,071.8      25.6
redo size                          18,644,947,688   23,073,410,468      23.8     61,829,138.5   76,420,493.9      23.6
redo synch long waits                         343            4,890   1,325.7              1.1           16.2   1,321.1
redo synch time                           541,804          354,625     -34.5          1,796.7        1,174.5     -34.6
redo synch time (usec)              5,418,056,862    3,546,209,390     -34.5     17,967,000.7   11,745,254.3     -34.6
redo synch time overhead (usec)       145,664,759      197,925,281      35.9        483,043.8      655,540.2      35.7
redo synch time overhead count (  2ms)  2,295,847        2,821,726      22.9          7,613.3        9,345.7      22.8
redo synch time overhead count (  8ms)        443            3,704     736.1              1.5           12.3     734.7
redo synch time overhead count ( 32ms)          2                9     350.0              0.0            0.0     200.0
redo synch writes                       2,305,502        2,849,645      23.6          7,645.4        9,438.2      23.5
redo wastage                          179,073,264    2,703,864,280   1,409.9        593,830.9    8,955,357.7   1,408.1
redo write finish time                291,094,266      277,884,591      -4.5        965,307.5      920,370.1      -4.7
redo write gather time                 63,237,013      125,066,420      97.8        209,702.4      414,227.3      97.5
redo write info find                    2,296,292        2,825,439      23.0          7,614.8        9,358.0      22.9
redo write schedule time               63,679,682      125,819,850      97.6        211,170.3      416,722.8      97.3
redo write size count (   4KB)             12,220                0                       40.5             0
redo write size count (   8KB)             26,420            2,246     -91.5             87.6            7.4     -91.5
redo write size count (  16KB)             69,674           94,557      35.7            231.0          313.2      35.5
redo write size count (  32KB)            108,676          268,794     147.3            360.4          890.3     147.0
redo write size count ( 128KB)            106,651          253,669     137.8            353.7          840.2     137.6
redo write size count ( 256KB)             37,332           28,076     -24.8            123.8           93.0     -24.9
redo write size count ( 512KB)              7,328            2,382     -67.5             24.3            7.9     -67.5
redo write size count (1024KB)                 28               28       0.0              0.1            0.1       0.0
redo write time                            29,126           27,817      -4.5             96.6           92.1      -4.6
redo write time (usec)                291,261,420      278,162,437      -4.5        965,861.8      921,290.4      -4.6
redo write total time                 306,213,383      298,786,696      -2.4      1,015,444.5      989,599.1      -2.5
redo write worker delay (usec)         38,246,633       73,452,748      92.1        126,830.9      243,279.8      91.8
redo writes                               368,330          649,751      76.4          1,221.4        2,152.0      76.2
redo writes (group 0)                     366,492          648,430      76.9          1,215.3        2,147.6      76.7
redo writes (group 1)                       1,838            1,321     -28.1              6.1            4.4     -28.2
redo writes adaptive all                  368,330          649,752      76.4          1,221.4        2,152.0      76.2
redo writes adaptive worker               368,330          649,752      76.4          1,221.4        2,152.0      76.2
I’ve added a few things that were masked by the AWR Diff Report. The writes lower than 4k is zero in the second snapshots because it’s the blocksize.
It’s interesting to see that redo size is higher and this is because you write 4k even when you have less. This is measured by ‘redo wastage’.
So, larger blocksize lowers the latency but increases the volume. Here, where NVMe optimizes the bandwidth to Flash storage, it may not be a problem.
So what?
You have to keep in mind that this workload, with lot of small transactions and no other waits, is a special workload for this test. If you are not in this extreme case, then the default block size is probably sufficient for latency and reduces the redo size. However, if log file sync latency is your bottleneck, you may consider increasing the blocksize.
Thanks to
![]() Oracle Authorized Solution Center, Switzerland.
Oracle Authorized Solution Center, Switzerland.
Those tests were done on ODA X6-2M at Arrow OASC. Arrow has a wide range of Engineered Systems available for Oracle partners, like dbi services, and for customers to do Proof of Concepts, demos, learning, benchmarks, etc.

![Thumbnail [60x60]](https://www.dbi-services.com/blog/wp-content/uploads/2022/12/oracle-square.png)
![Thumbnail [90x90]](https://www.dbi-services.com/blog/wp-content/uploads/2022/08/STH_web-min-scaled.jpg)
![Thumbnail [90x90]](https://www.dbi-services.com/blog/wp-content/uploads/2025/11/LTO_WEB.jpg)
![Thumbnail [90x90]](https://www.dbi-services.com/blog/wp-content/uploads/2023/01/APY_web-scaled.jpg)
![Thumbnail [90x90]](https://www.dbi-services.com/blog/wp-content/uploads/2022/08/FRJ_web-min-scaled.jpg)