In any monitoring tool, the question of alerting arises. Prometheus has a component dedicated to this function called the “Alertmanager”. One of the strengths of Alertmanager is its ability to evaluate and group alerts, thus avoiding false positives and waves of notifications.
This is made possible by four functions of Alertmanager, which are:
- Routing is the ability to send alerts to various receivers, including Slack, Pagerduty, and email. It is the core feature of Alertmanager.
- Inhibition is the process of muting downstream alerts depending on their label set.
- Silencing allows you to temporarily snooze an alert if you expect it to trigger for a scheduled procedure, such as database maintenance, or if you’ve already acknowledged the alert during an incident and want to keep it from renotifying while you remediate.
- Throttling solves a similar pain point but in a slightly different fashion. Throttles allow the user to tailor the renotification settings with three primary parameters:
group_wait
group_interval
repeat_interval - Grouping in Alertmanager allows multiple alerts sharing a similar label set to be sent simultaneously.
After this brief introduction to an alertmanager, I suggest looking at how to install and configure it with Prometheus.
Installing Prometheus Alertmanager
Install Alertmanager
As part of this blog, we will perform the installation on a Debian distribution with 2 CPUs and 8GB of RAM (Ubuntu 22.04 – Jammy Jellyfish), which includes a recent version of Prometheus (version 2.44.0) and Node_exporter (version 1.6.0).
Let’s start by creating a user and a group for the Alertmanager:
sudo useradd -M -r -s /bin/false alertmanager
Next, we will download the binaries for the Alertmanager. To do this, I invite you to choose your version from the official website’s download page.
In our case, we will go with version 0.25.0
am_version=0.25.0

wget https://github.com/prometheus/alertmanager/releases/download/v$am_version/alertmanager-$am_version.linux-amd64.tar.gz
Extract the file:
tar -xvf ./alertmanager-$am_version.linux-amd64.tar.gz
Copy the Alertmanager binary file to /usr/local/bin/:
sudo cp alertmanager-$am_version.linux-amd64/alertmanager /usr/local/bin/
Set the ownership:
sudo chown alertmanager:alertmanager /usr/local/bin/alertmanager
Make the directory that will contain the configuration files:
sudo mkdir -p /etc/alertmanager
Move the default configuration file to the new directory:
sudo cp alertmanager-$am_version.linux-amd64/alertmanager.yml /etc/alertmanager
Set the ownership:
sudo chown -R alertmanager:alertmanager /etc/alertmanager
Create a directory to serve as local storage for Alertmanager to use:
sudo mkdir -p /var/lib/alertmanager
Set the ownership:
sudo chown alertmanager:alertmanager /var/lib/alertmanager
Create a systemd unit file:
sudo vi /etc/systemd/system/alertmanager.service
Add the following to the file to download and install the Alertmanager binaries:
[Unit]
Description=Prometheus
Alertmanager Wants=network-online.target
After=network-online.target

[Service]
User=alertmanager
Group=alertmanager
Type=simple
ExecStart=/usr/local/bin/alertmanager \
  --config.file /etc/alertmanager/alertmanager.yml \
  --storage.path /var/lib/alertmanager/

[Install]
WantedBy=multi-user.target
Enable the alertmanager service so it starts automatically on boot:
sudo systemctl enable alertmanager
Start the alertmanager service:
sudo systemctl start alertmanager
Verify the service is running:
sudo systemctl status alertmanager
● alertmanager.service - Prometheus
     Loaded: loaded (/etc/systemd/system/alertmanager.service; enabled; vendor preset: enabled)
     Active: active (running) since Tue 2023-06-06 04:04:48 UTC; 57s ago
   Main PID: 2108 (alertmanager)
      Tasks: 8 (limit: 4632)
     Memory: 13.1M
        CPU: 229ms
     CGroup: /system.slice/alertmanager.service
             └─2108 /usr/local/bin/alertmanager --config.file /etc/alertmanager/alertmanager.yml --storage.path /var/lib/alertmanager/

Jun 06 04:04:48 dbi-alertmanager01 alertmanager[2108]: ts=2023-06-20T04:04:48.871Z caller=main.go:240 level=info msg="Starting Alertmanager" version="(version=0.25.0, branch=HEAD, revision=258fab7cdd551f2cf251ed0348f0ad7289aee789)"
Jun 06 04:04:48 dbi-alertmanager01 alertmanager[2108]: ts=2023-06-20T04:04:48.871Z caller=main.go:241 level=info build_context="(go=go1.19.4, user=root@abe866dd5717, date=20221222-14:51:36)"
Jun 06 04:04:48 dbi-alertmanager01 alertmanager[2108]: ts=2023-06-20T04:04:48.876Z caller=cluster.go:185 level=info component=cluster msg="setting advertise address explicitly" addr=172.31.118.31 port=9094
Jun 06 04:04:48 dbi-alertmanager01 alertmanager[2108]: ts=2023-06-20T04:04:48.884Z caller=cluster.go:681 level=info component=cluster msg="Waiting for gossip to settle..." interval=2s
Jun 06 04:04:48 dbi-alertmanager01 alertmanager[2108]: ts=2023-06-20T04:04:48.980Z caller=coordinator.go:113 level=info component=configuration msg="Loading configuration file" file=/etc/alertmanager/alertmanager.yml
Jun 06 04:04:48 dbi-alertmanager01 alertmanager[2108]: ts=2023-06-20T04:04:48.981Z caller=coordinator.go:126 level=info component=configuration msg="Completed loading of configuration file" file=/etc/alertmanager/alertmanager.yml
Jun 06 04:04:48 dbi-alertmanager01 alertmanager[2108]: ts=2023-06-20T04:04:48.988Z caller=tls_config.go:232 level=info msg="Listening on" address=[::]:9093
Jun 06 04:04:48 dbi-alertmanager01 alertmanager[2108]: ts=2023-06-20T04:04:48.988Z caller=tls_config.go:235 level=info msg="TLS is disabled." http2=false address=[::]:9093
Jun 06 04:04:50 dbi-alertmanager01 alertmanager[2108]: ts=2023-06-20T04:04:50.885Z caller=cluster.go:706 level=info component=cluster msg="gossip not settled" polls=0 before=0 now=1 elapsed=2.000988159s
Jun 06 04:04:58 dbi-alertmanager01 alertmanager[2108]: ts=2023-06-20T04:04:58.888Z caller=cluster.go:698 level=info component=cluster msg="gossip settled; proceeding" elapsed=10.004121638s
Verify you can reach it: curl http://localhost:9093
You can also access Alertmanager in a web browser at http://<ALERTMANAGER_SERVER_IP>:9093.
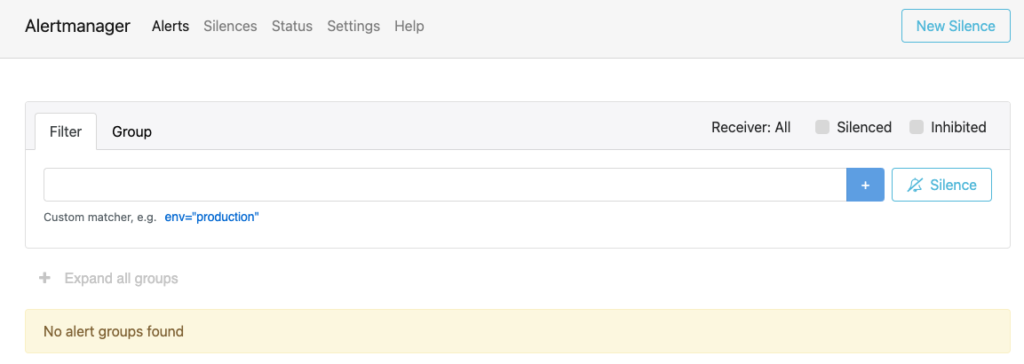
You can test the Alertmanager by quickly creating a silence, even though the application is not yet connected to Prometheus. The creation of silence can be done through the graphical interface, which is quite intuitive.
Click on the “Silences” tab, and click on the button “New Silence”
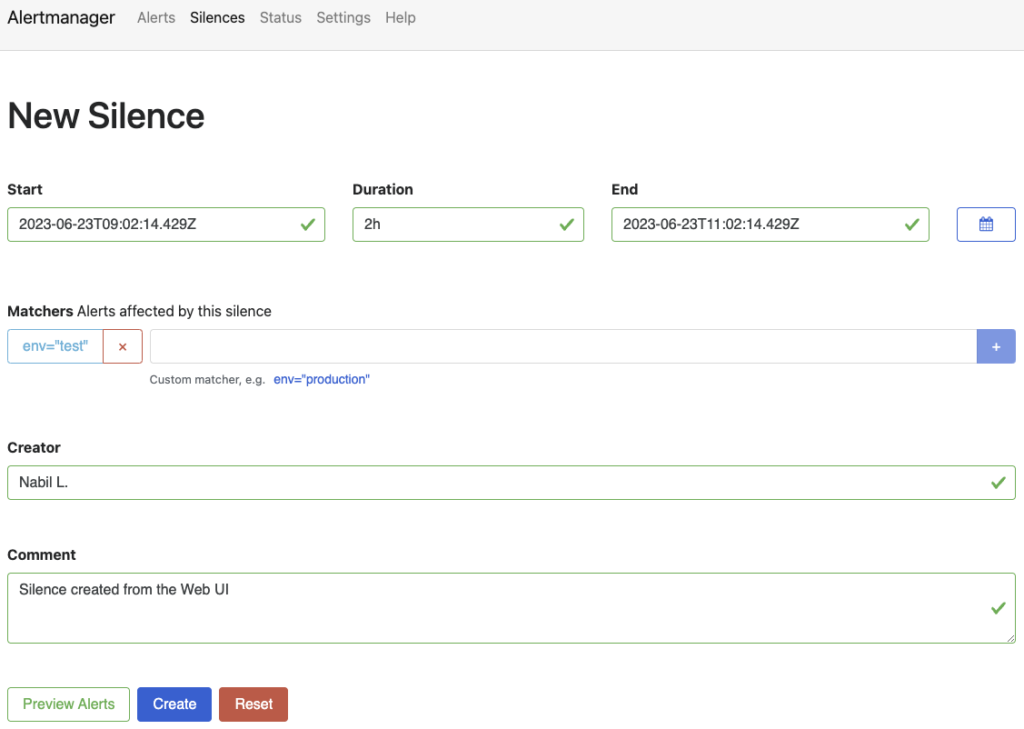
From the “New Silence” view, specify the duration for the silence, which is the period during which the alert will be muted and set the “Matchers” for the alerts affected by the silence.
Optionally, add a comment to provide a description or reason for the silence.
Click on the “Create” button to create the silence.
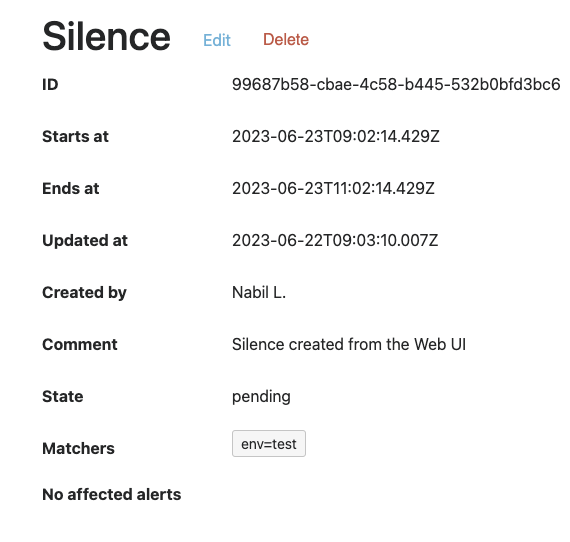
A summary will be displayed with the ID of the silence.
For those interested in automating silence tasks, it is also possible to generate them using the REST API.
As a bonus, here’s an example of how to create silence using the REST API:
curl -X POST http://localhost:9093/api/v2/silences -H "Content-Type: application/json" -d '{
  "matchers": [
    {
      "name": "ENV",
      "value": "Test",
      "isRegex": false
    }
  ],
  "startsAt": "2023-06-23T08:00:00.533330795Z",
  "endsAt": "2023-06-25T23:11:44.603Z",
  "createdBy": "Nabil",
  "comment": "dbi blog - Silent with Rest API",
  "status": {
    "state": "active"
  }
}'
Make sure to replace http://localhost:9093 with the correct URL for your AlertManager instance.
Modify the values in the JSON payload to match your requirements, and execute the command to create the silence via the REST API.
The command should return the silence ID that you have created.
{"silenceID":"bf9ee8d5-3114-4437-80a1-e9ae5d2c5e66"}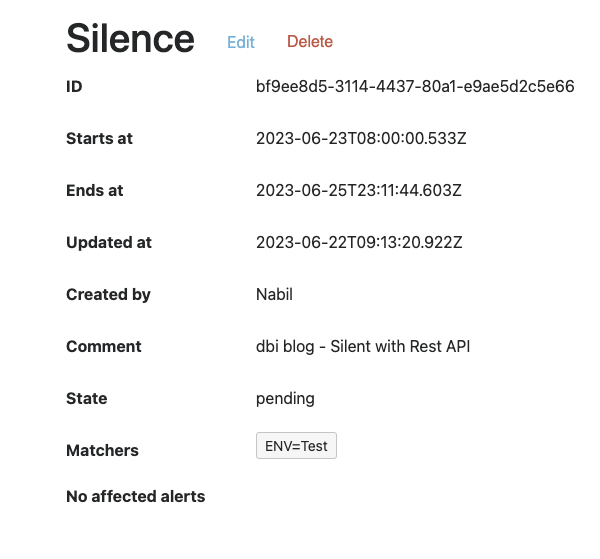
I will cover the REST API part in more detail in another blog.
Install amtool
The “amtool” is a command-line tool that comes bundled with Alertmanager.
It provides a set of utilities to interact with Alertmanager and perform various administrative tasks like querying alerts, managing silences, testing notification templates, validating configuration and performing health checks aso…
Here’s how to install the amtool binary:
sudo cp alertmanager-$am_version.linux-amd64/amtool /usr/local/bin/
Make the directory that will contain the configuration file:
sudo mkdir -p /etc/amtool
Create a config file for amtool:
sudo vi /etc/amtool/config.yml
Enter the following content in the config file:
alertmanager.url: http://localhost:9093
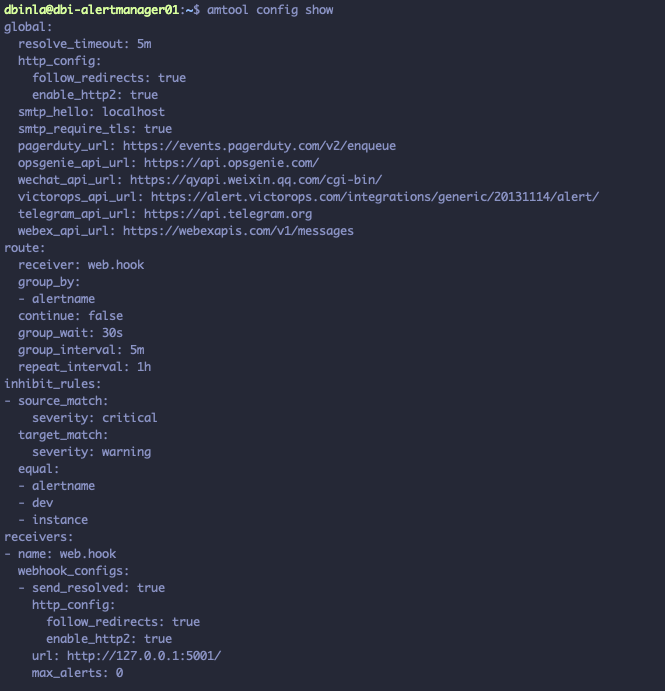
Verify amtool is working by pulling the current Alertmanager configuration: amtool config show
We should see the default configuration.
Configure Prometheus to Use Alertmanager
We are now reaching the final step, connecting our Alertmanager with our Prometheus application.
Open the Prometheus config file: sudo vi /etc/prometheus/prometheus.yml
Under alerting, add your Alertmanager as a target:
alerting: alertmanagers:
static_configs:
targets: ["localhost:9093"]
Restart Prometheus to reload the configuration: sudo systemctl restart prometheus
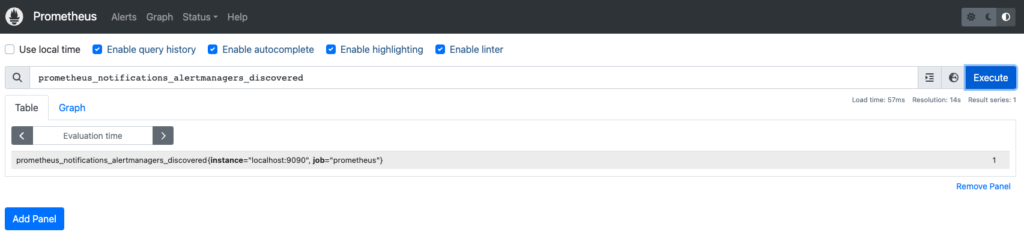
Access the Prometheus Expression Browser in a web browser at http://<PROMETHEUS_SERVER_IP>:9090/graph.
Enter the following in the query box: prometheus_notifications_alertmanagers_discovered, and ensure the current value is 1.
prometheus_notifications_alertmanagers_discovered is a metric in Prometheus that provides information about the number of Alertmanager instances discovered by Prometheus for sending notifications.
And there you have it. That’s about everything you need to know to install and configure an Alertmanager.
![Thumbnail [90x90]](https://www.dbi-services.com/blog/wp-content/uploads/2022/08/ADE_WEB-min-scaled.jpg)
![Thumbnail [90x90]](https://www.dbi-services.com/blog/wp-content/uploads/2022/08/NME_web-min-scaled.jpg)
![Thumbnail [90x90]](https://www.dbi-services.com/blog/wp-content/uploads/2022/08/GRE_web-min-scaled.jpg)