A couple of weeks ago, I had an interesting discussion with one of my customer about the page life expectancy (aka PLE). He asked me if monitoring the metric value is a best practice because he often noticed a big drop of the PLE under the recommended threshold during the night or sometimes during the business hours. In addition, he didn’t want to get false positive especially during the night when maintenance tasks are performed without any impact against critical business activity 🙂
Indeed, in some specific cases regarding which task is running, a sudden PLE value drop does not necessarily mean you experience some memory pressure issues with data pages flushed out from the buffer pool or at least not what we may think. This discussion with my customer was a good opportunity to introduce some interesting concepts about SQL Server buffer pool management. Let me demonstrate with some examples:
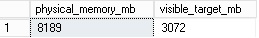
Firstly, let’s introduce my lab environment that includes a SQL Server instance capped to 3GB. As an aside, you may notice that I voluntary cap my SQL Server instance with a pretty low memory value in order to reach quickly the limits of my buffer pool. Indeed, I will work with databases and tables which may potentially fill up quickly my buffer pool and this is the intended behaviour here.
SELECT
	physical_memory_kb / 1024 as physical_memory_mb,
	visible_target_kb / 1024 as visible_target_mb
FROM sys.dm_os_sys_info;
go
![]()
I will also use two databases named AdventureWorks2012 and ApplixEnterprise for the first with the following characteristics:
USE AdventureWorks2012;
GO
EXEC sp_spaceused;
GO

USE ApplixEnterprise;
GO
EXEC sp_spaceused;
GO
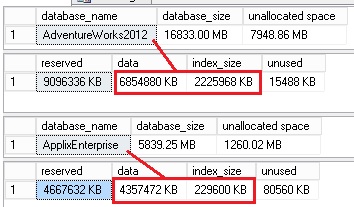
So the AdventureWorks2012 and ApplixEnterprise database sizes are respectively 8GB and 4.5GB (data itself and indexes included).
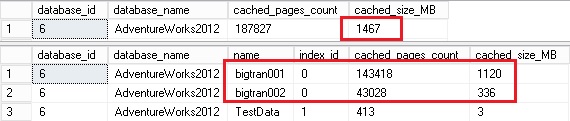
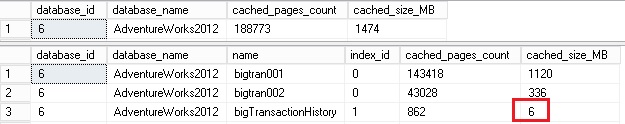
Let’s start with this initial scenario. I have populated the BP with data pages related to two tables named dbo.bigtran001 and dbo.bigtran002. Here the picture of the BP:
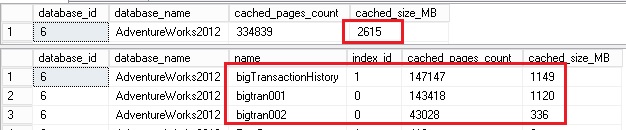
Now let’s populate again the BP with the bigTransactionHistory table as shown below:
At this point, before running the population of the first two tables, let’s say I have enabled a special extended event session for tracing page disfavoring. Be patient, I will introduce page disfavoring concept later in this blog.
CREATE EVENT SESSION bpdisfavoured
ON SERVER
ADD EVENT sqlserver.leaf_page_disfavored
(
	ACTION (sqlserver.sql_text)
)
ADD TARGET package0.event_file
(
	SET FILENAME = 'C:\Demo\bpdisfavoured.xel'
);
GO
I extracted then the number of disfavoured pages by query as follows:
WITH xe_disfavour
AS
(
	SELECT
		n.value('(action[@name="sql_text"]/value)[1]','varchar(max)') AS sql_stmt,
		n.value('(data[@name="page_id"]/value)[1]','bigint') AS page_id
	FROM
	(
		select CAST(event_data AS XML) as event_data
		FROM sys.fn_xe_file_target_read_file('C:\Demo\bpdisfavoured*.xel', NULL, NULL,  NULL)
	) as XEL
	CROSS APPLY event_data.nodes('event') as q(n)
)
SELECT
	sql_stmt,
	COUNT(*) as nb_pages,
	COUNT(*) / 128 as size_mb
FROM xe_disfavour
GROUP BY sql_stmt
![]()
You may notice that only the query that used the bigTransactionHistory table is concerned. In other words, data pages related to bigTransactionHistory table were disfavoured from the buffer pool. So what is BP disfavoring?. I remember to get a quick overview during my MCM training a couple of years ago and Paul Randal wrote about it a very interesting blog post in February 2013. First of all, I wanted to thank him for confirmation that I was on the right track. I don’t pretend to know all about the the page disfavoring feature and probably some topics are still missing. So the next part of this blog is based on my own research based on the Paul Randal’s blog and what I picked up from my MCM training.
So Let’s take a look at the total size of this table (2245MB). Normally, we would expect that we retrieve the same data size in the BP but this is not what we may notice here. The data cached size is equal to 1149MB and more surprising we would expect that a certain part of other data pages related to the bigtran001 and bigtran002 tables were flushed out from the BP. I will go back to this point later in this blog post.
Now let’s perform a second test by executing a DBCC CHECKDB command against the ApplixEnterprise database. Regarding the total data size of this database (4GB), this time we may expect that data pages related to the AdventureWorks2012 database will be flushed out the BP.
DBCC CHECKDB ('ApplixEnterprise') WITH NO_INFOMSGS, ALL_ERRORMSGS;
GO
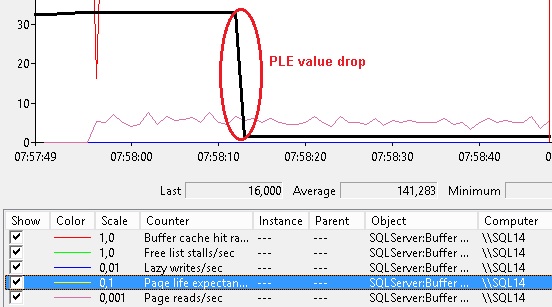
So firstly, let’s have a look at a predefined set of perfmon counters related to the SQL Server instance buffer cache usage:
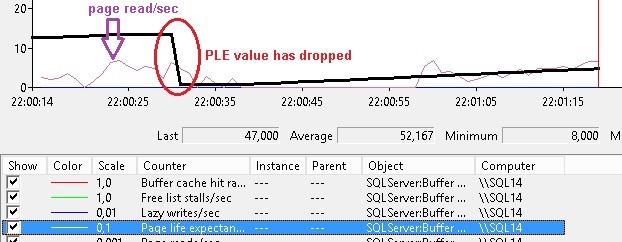
We may see a common scenario during maintenance tasks execution as integrity database checks. The value of the PLE has drastically dropped to 47 and under the recommended threshold value. We may guess that the SQL Server instance is suffering from memory pressure during this period with a potential drop of the actual buffer cache. After all, the ApplixEnterprise database size (4GB) is large enough to trigger this type of event but let’s have a look after the DBCC CHECKDB has finished.
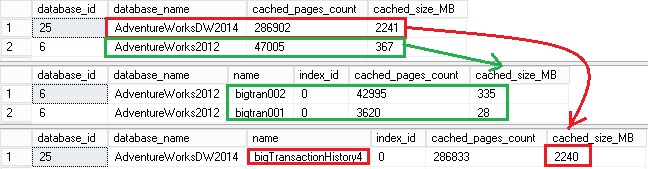
Not as bad as we may think … the bigtran001 and bigtran002 table don’t seem to have experienced memory pressure. The only exception concerns the bigTransactionHistory table but in fact this is an expected behaviour because the related data pages are already disfavored. However, what is surprising is that data pages read by DBCC CHECKDB are not reported by the extended event session. I will investigate further about this point.
Note: I got this specific behaviour because the two bigtranXXX tables were recently used and performing the same test with a longer time interval between the last query of these tables and the execution of the DBCC command led to an aggressive flush out of the overall AdventureWorks2012 database. I guess that the behaviour is tightly related to the LRU algorithm used by SQL Server and the eviction policy.
Another point I want to cover in this blog post is the use of long reporting queries during the night in order to process and prepare reports. This is also a common activity I may see at customer places and they are performed usually on nightly basis and they lead often to a PLE value drop. But it is not uncommon to see this kind of activity during the business hours directly on the OLTP database.
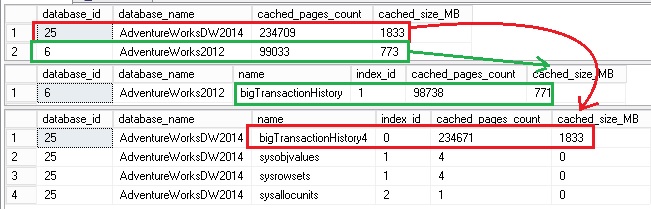
Let’s first populate my BP with 3 tables with no potential disfavoured data pages. Here the picture of the BP after querying these tables:
This time I populated the BP with enough data to leave no room enough for the data pages from my next query. Currently the BP contains three 3 tables bigtran001, bigtran002 from the AdventureWorks2012 database as well as the bigTransactionHistory4 from the AdventureWorksDW2014 database. On one hand, the BP already contains roughly 2,6GB and the max memory value was fixed to 3GB and on the other hand my next query will include the bigTransactionHistory table with roughly 1.5GB of additional data… So if my assumption is correct, the current data pages in the BP should not be flushed out (at least in an aggressively manner). Let’s verify …
Let’s first take a look at the BPE counter:
As expected we may notice a drop of the PLE value.
Let’s move on the buffer pool picture:
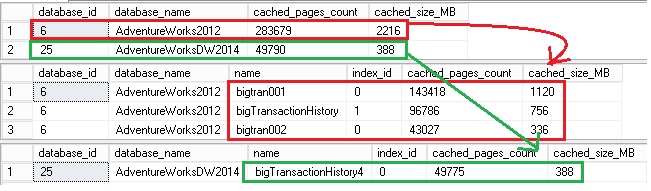
Ok assumption verified here. The amount of data pages associated to the bigTransactionHistory4 were flushed out in a very low order of magnitude (52231 data pages or 18% of the total cache size). On the contrary, the bigtran001 and bigtran002 tables were completely flushed out from the BP. My guess here is that SQL Server has referred the LRU algorithm in order to prioritize the flushing out process. In my scenario, I executed first the queries with the bigtran001 and bigtran002 tables and then the query with the bigTransactionHistory4 table. In this case, my assumption is data pages related to both the bigtran001 and bigtran002 tables will be more affected by the flushing process compared to the bigTransactionHistory4 table. However, I tried to reverse my query execution path by beginning first with the bigTransactionHistory4 table and then the bigtran001 and bigtran002 tables.
You may notice that the story has changed here. This time, the bigTransactionHistory4 table is more concerned by the flushing out process than the bigtran001 and bigtran002 tables.
The bottom line is that we should be aware of some internal processes used by specific SQL Server commands before jumping to any conclusions. Experiencing a drop of PLE value doesn’t necessarily mean you will have to get additional memory. Just to be clear, I don’t claim that PLE is not a reliable indicator of memory pressure but we saw a good example with the DBCC CHECKDB command which disfavours data pages in order to avoid bloating the BP with unnecessary data pages. In my case, it is obvious to notice this behaviour. After all, as said previously in this blog post the DBCC CHECKDB uses the BP internally and if the related data pages are disfavoured immediately, the PLE is affected but SQL Server keeps data pages from objects accessed frequently by your workload. Of course, in the context of my blog post, I was in a situation that promoted very quickly the flush of data pages out the buffer cache but it is not uncommon to see either DBCC CHECKDB command performed against large databases or reporting queries executed against large tables that may potentially trigger the same phenomena. With an environment with sufficient memory to handle all the databases in the BP, you will probably not face a PLE value drop. Finally, you have probably noticed that I didn’t talk about the sys.dm_db_index_physical_stats DMF. In fact, I didn’t noticed any page disfavoring effect from my tests but I’ve heard the opposite around me. I will come back either after performing further tests or getting more information.
See you!
By David Barbarin
![Thumbnail [60x60]](https://www.dbi-services.com/blog/wp-content/uploads/2022/12/microsoft-square.png)
![Thumbnail [90x90]](https://www.dbi-services.com/blog/wp-content/uploads/2022/08/STH_web-min-scaled.jpg)
![Thumbnail [90x90]](https://www.dbi-services.com/blog/wp-content/uploads/2025/11/LTO_WEB.jpg)
![Thumbnail [90x90]](https://www.dbi-services.com/blog/wp-content/uploads/2023/01/APY_web-scaled.jpg)