By Franck Pachot
.
I’ve read this morning that MapReduce is dead. The first time I heard about MapReduce was when a software architect proposed to stop writing SQL on Oracle Database and replace it with MapReduce processing. Because the project had to deal with a huge amount of data in a small time and they had enough budget to buy as many cores as they need, they wanted the scalability of parallel distributed processing.
The architect explained how you can code filters and aggregations in Map & Reduce functions and then distribute the work over hundreds of CPU cores. Of course, it’s very interesting, but it was not actually new. I was doing this for years on Oracle with Parallel Query. And not only filters and aggregations, but joins as well – and without having to rewrite the SQL statements.
I don’t know if MapReduce is dead, but for 20 years we are able to just flip a switch (ALTER TABLE … PARALLEL …) and bring scalability with parallel processing. Given that we understand how it works.
Reading a parallel query execution plan is not easy. In this post, I’ll just show the basics. If you need to go further, you should have a look at some Randolf Geist presentations and read his Understanding Parallel Execution article. My goal is not to go very deep, but only to show that it is not that complex.
I’ll explain how Parallel query works by showing an execution plan for a simple join between DEPT and EMP tables where I want to read EMP in parallel – and distribute the join operation as well.
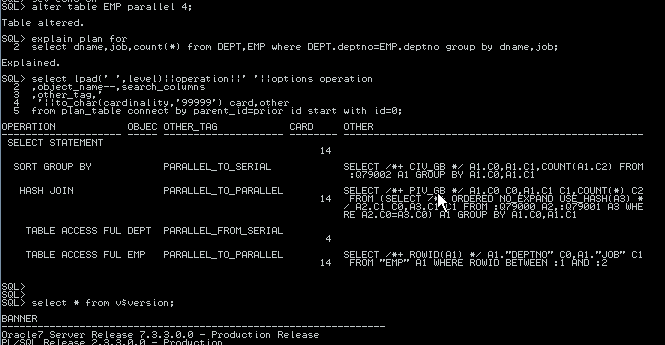
For the fun of it, and maybe because it’s easier to read at the first time, I’ve done the execution plan on an Oracle 7.3.3 database (1997):
Let’s start by the end. I want to read the EMP table by several processes (4 processes because I’ve set the parallel degree to 4 on table EMP). The table is not partitioned. It is a heap table where rows are scattered into the segment without any specific clustering. So each process will process an arbitrary range of blocks and this is why you see an internal query filtering on ROWID between :1 and :2. My session process, which is known as the ‘coordinator’, and which will be represented in green below, has divided the range of rowid (it’s a full table scan, that reads all blocks from start to high water mark) and has mandated 4 ‘producer’ processes to do the full scan on their part. Those producers are represented in dark blue below.
But then there is a join to do. The coordinator could collect all the rows from the ‘producer’ processes and do the join, but that is expensive and not scalable. We want the join to be distributed as well. Each producer process can read the DEPT table and do the join, which is fine if it is a small table only. But anyway, we don’t want the DEPT table to be read in parallel because we have not set a parallel degree on it. So the EMP table will be read by only one process: my session process, which does all the no-parallel (aka the serial) things in addition to its ‘coordinator’ role.
Then we have a new set of 4 processes that will do the Hash Join. They need some rows from DEPT and they need some rows from EMP. They are the ‘consumer’ processes that will consume rows from ‘producers’, and are represented in pink below. And they don’t need them randomly. Because it is a join, each ‘consumer’ process must have the pairs of rows that match the join columns. In the plan above, you see an internal query on internal ‘table queue’ names. The parallel full scan on EMP distributes its rows: it’s a PARALLEL_TO_PARALLEL distribution, the parallel producers sending their rows to parallel consumers. The serial full scan on DEPT distributes its rows as well: it’s a PARALLEL_FROM_SERIAL distribution, the parallel consumers receiving their rows from the serial coordinator process. The key for both distributions are given by a hash function on the join column DEPTNO, so that rows are distributed to the 4 consumer processes, but keeping same DEPTNO into the same process.
We have a group by operation that will be done in parallel as well. But the processes that do the join on DEPTNO cannot do the group by which is on others columns (DNAME,JOB). So we have to distribute the rows again, but this time the distribution key is on DNAME and JOB columns. So the join consumer processes are also producers for the group by operation. And we will have a new set of consumer processes that will do the join, in light blue below. That distribution is a PARALLEL_TO_PARALLEL as it distributes from 4 producers arranged by (DEPTNO) to 4 consumers arranged by (DNAME,JOB).
At the end only one process receives the result and sends it to the client. It’s the coordinator which is ‘serial’. So it’s a PARALLEL_TO_SERIAL distribution.
Now let’s finish with my Oracle 7.3.3 PLAN_TABLE and upgrade to 12c which can show more detailed and more colorful execution plans. See here on how to get it.
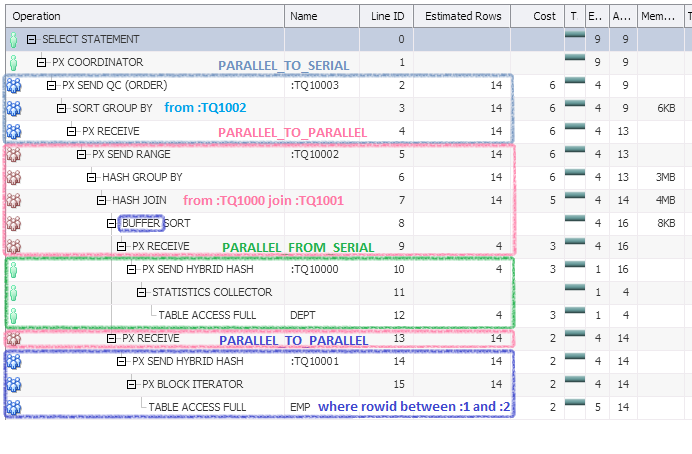
I’ve added some color boxes to show the four parallel distributions that I’ve detailed above:
- :TQ10001 Parallel full scan of EMP distributing its rows to the consumer processes doing the join.
- :TQ10000 Serial full scan of DEPT distributing its rows to the same processes, with the same hash function on the join column.
- :TQ10002 The join consumer receiving both, and then becoming the producer to send rows to the consumer processes doing the group by
- :TQ10003 Those consumer processes doing the group by and sending the rows to the coordinator for the final result.
So what is different here?
First we are in 12c and the optimizer may choose to broadcast all the rows from DEPT instead of the hash distribution. It’s the new HYBRID HASH distribution. That decision is done when there are very few rows and this is why they are counted by the STATISTICS COLLECTOR.
We don’t see the predicate on rowid ranges, but the BLOCK ITERATOR is there to show that each process reads its range of blocks.
And an important point is illustrated here.
Intra-operation parallelism can have a high degree (here I’ve set it to 4 meaning that each parallel operation can be distributed among 4 processes). But Inter-operation parallelism is limited to one set of producer sending rows to one set of consumers. We cannot have two consumer operations at the same time. This is why the :TQ0001 and the :TQ10003 have the same color: it’s the same processes that act as the EMP producer, and then when finished, then are reused as the GROUP BY consumer.
And there are additional limitations when the coordinator is also involved in a serial operation. For those reasons, in a parallel query plan, some non-blocking operations (those that can send rows above on the fly as they receive rows from below) have to buffer the rows before continuing. Here you see the BUFFER SORT (which buffers but doesn’t sort – the name is misleading) which will keep all the rows from DEPT in memory (or tempfiles when it’s big).
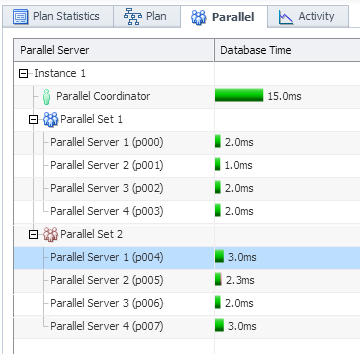
Besides the plan, SQL Monitoring show the activity from ASH and the time spent in each parallel process:
My parallel degree was 4 so I had 9 processes working on my query: 1 coordinator, two sets of 4 processes. The coordinator started to distribute the work plan to the other processes, then had to read DEPT and distribute its rows, and when completed it started to receive the result and send it to the client. The blue set of processes started to read EMP and distribute its rows, and when completed was able to process the group by. The red set of processes has done the join. The goal is to have the DB time distributed on all the processes running in parallel, so that the response time is equal to the longest one instead of the total. Here, it’s the coordinator which has taken 18 milliseconds. The query duration was 15 milliseconds:
This is the point of parallel processing: we can do a 32 ms workload in only 15 ms. Because we had several cpu running at the same time. Of course we need enough resources (CPU, I/O and temp space). It’s not new. We don’t have to define complex MapReduce functions. Just use plain old SQL and set a parallel degree. You can use all the cores in your server. You can use all the servers in your cluster. If you’re I/O bound on the parallel full scans, you can even use your Exadata storage cells to offload some work. And in the near future the CPU processing will be even more efficient, thanks to in-memory columnar storage.


![Thumbnail [60x60]](https://www.dbi-services.com/blog/wp-content/uploads/2022/12/oracle-square.png)
![Thumbnail [90x90]](https://www.dbi-services.com/blog/wp-content/uploads/2025/07/ALK_MIN.jpeg)
![Thumbnail [90x90]](https://www.dbi-services.com/blog/wp-content/uploads/2025/05/JDE_Web-1-scaled.jpg)
![Thumbnail [90x90]](https://www.dbi-services.com/blog/wp-content/uploads/2022/08/JDU_web-min-scaled.jpg)