Nagios Remote Plugin Executor, in short NRPE, is the nagios server plugin required to call script hosted on agents we want to monitor. You might wonder why I would try this agent when I am not using Nagios server. Well, the client as well as the protocol also became some sort of standard as many tools are compatible with it. I decided to test its integration with EV Observe a cloud-base monitoring solution from EasyVista.
In this blog post, I will setup basic Java Virtual Machine monitoring on a WildFly server with help of Nagios agent.
Agent Installation
I will not go to much in details as there are many resources on the pure installation part. For my test, I installed it from source.
I am validating installation, including network connectivity, by running check_nrpe test from EV Observe box:
$ /usr/local/nagios/libexec/check_nrpe -H 10.0.0.225
NRPE v4.1.0
Agent Customization
Default path of configuration file is /usr/local/nagios/etc/nrpe.cfg. I need to declare a new command to allow server to call as well for agent to know what to do with the call command:
command[check_jstat]=sudo usr/local/nagios/libexec/check_jstat -j jboss-modules.jar -P /app/Java/jdk
Let’s decompose it to understand it:
- command: declaration of a new command
- check_jstat: the name of the command
- after equal sign: the command that will be run
Keep in mind that the command will be run by nagios agent which implies it will be run as nagios user. Hence, we must update sudo: (always edit with visudo)
$ visudo /etc/sudoers.d/nagios
I put following content in this file:
Defaults:nagios !requiretty
nagios ALL=(root) NOPASSWD: /usr/local/nagios/libexec/check_jstat
Note that I used check_jstat.sh script from that git repository. I remove .sh extension from it.
And finally, the test:
# /usr/local/nagios/libexec/check_nrpe  -H <AGENT_IP> -c check_jstat
OK:jstat process jboss-modules.jar alive, | jboss-modules.jar_heap=301638656B;1932735283;2040109465;0;2147483648 jboss-modules.jar_heap_ratio=14%;90;95;0;100 jboss-modules.jar_perm=114354176B;573780787;605657497;0;637534208 jboss-modules.jar_perm_ratio=17%;90;95;0;100
Format is the standard format that nagios is using:
- before pipe (|) is the service status (ie. OK) followed by a message (jstat process jboss-modules.jar alive)
- After pipe, we have as many perfdata as script is generating. For check_jstat plugin, there are 4 which are associated to the running jar name (ie. jboss-modules.jar):
- jar_heap
- jar_heap_ratio
- jar_perm
- jar_perm_ratio
- Each metrics has:
- current value
- max value
- ratio
- warning threshold
- critical threshold
Troubleshooting
If test is failing, there are well known errors, but also a simple procedure to follow to get more clue on what is happening:
- Run command as nagios user on agent host. ie.:
/usr/local/nagios/libexec/check_jstat -J jboss-modules.jar -P /app/Java/jdk - run it from server host. ie.:
/usr/local/nagios/libexec/check_nrpe -H <AGENT_IP> -c check_jstat
Examples of error you could meet.
NRPE: Command ‘check_jstat’ not defined
Check the spelling of the command in nrpe.cfg on agent side and restart agent to apply any change.
CHECK_NRPE: Receive header underflow – only 0 bytes received (4 expected).
By default, server cannot add arguments to called commands. dont_blame_nrpe must be enabled to allow that:
dont_blame_nrpe=1
Enabling this option is a security risk.
UNKNOWN: No (or multiple) java app found
This error is specific to the check_jstat script, but the cause is more generic to Linux: nagios user can’t list process belonging to another OS user (wildfly, in my case).
EV Observe Integration
Service Creation
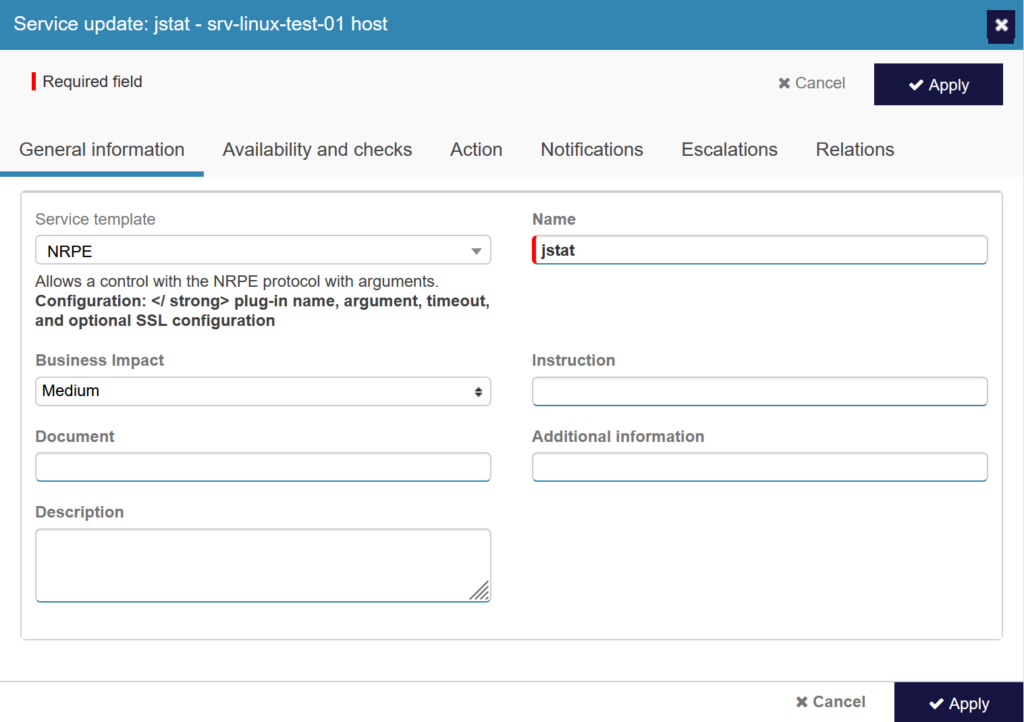
Now, we are ready to add this check in EV Observe. This will be added as a service with template NRPE:
Next, we must go into Availability and checks tab:
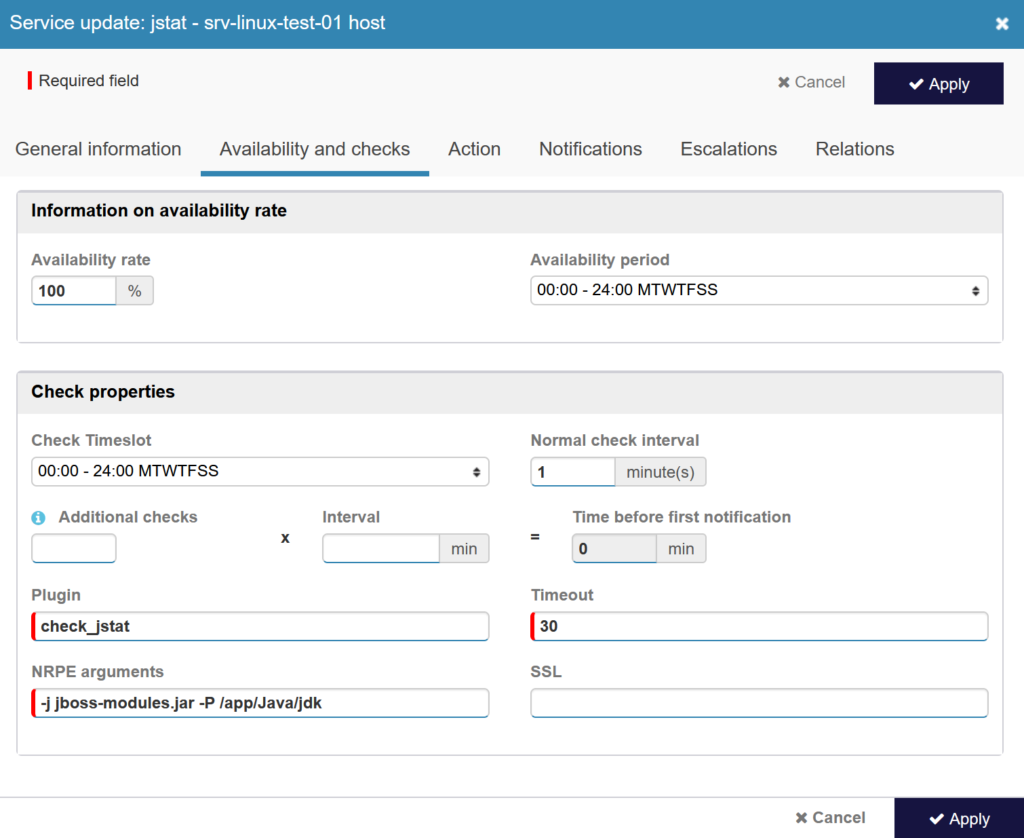
Important, and mandatory, parameters are in red:
- plugin name (ie. command): check_jstat
- timeout is the maximum time for command to return result
- additional NRPE arguments as needed. This field is mandatory, but it should not be as we already declared parameters in nrpe.cfg
Last step of this service creation is in Relation tab where I link service to host(s) to target it.
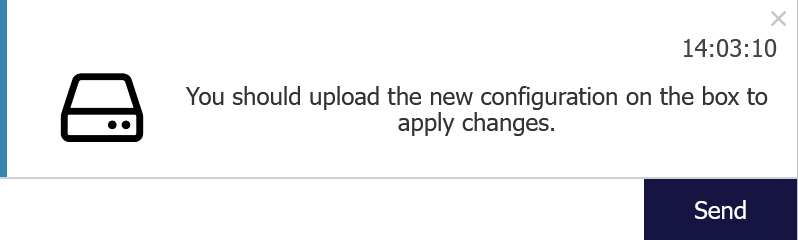
As suggested by web interface, we are ready to push configuration to the box:
After few seconds configuration is active and, I can trigger a check manually to confirm all is fine.
Check Service
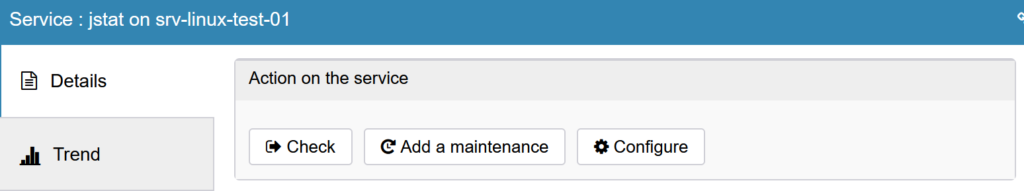
In Monitoring section, I can find by newly created service and trigger a check:
I can click Refresh button and get the metrics:
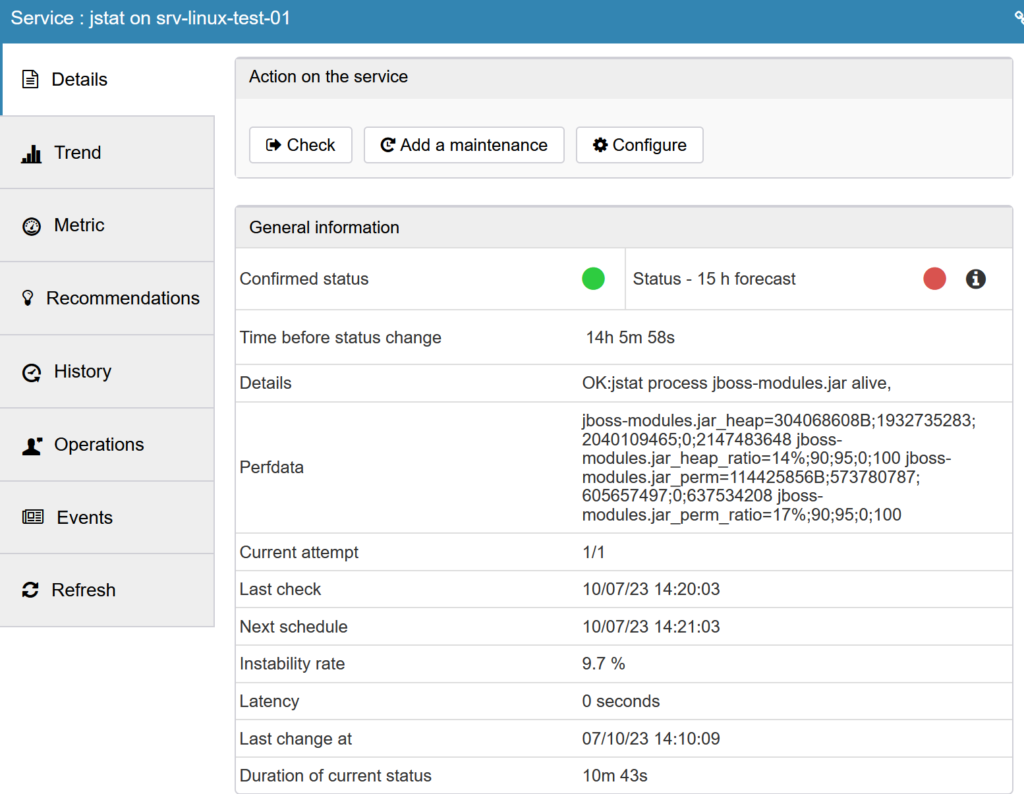
Status is green and Perfdata shows command output.
Finally, I can put these Perfdatas (jar_heap, jar_heap_ratio, jar_perm, jar_perm_ratio) in a dashboard:
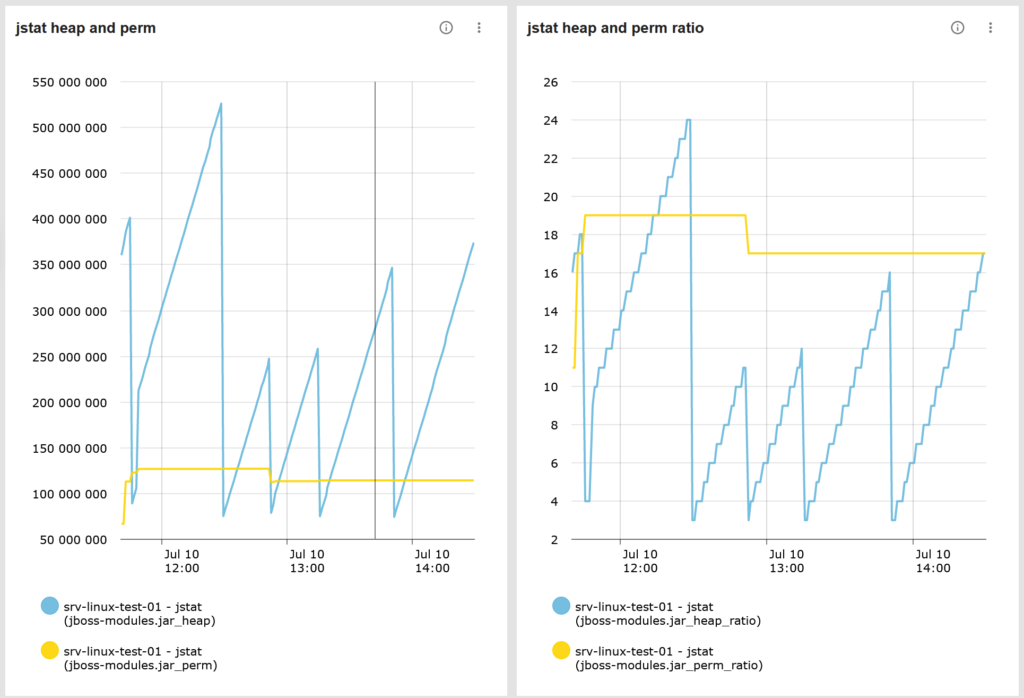
We can see the usual garbage collector pattern.
![Thumbnail [90x90]](https://www.dbi-services.com/blog/wp-content/uploads/2022/08/GRE_web-min-scaled.jpg)
![Thumbnail [90x90]](https://www.dbi-services.com/blog/wp-content/uploads/2022/09/DDI_web-min-scaled.jpg)