
Introduction
This second blog follows the first blog about deploying MySQL Server on Microsoft Azure. In the first blog, we saw how easy it is to deploy a MySQL server in minutes on the Azure cloud and we connected on it through the MySQL Shell client.
This second blog is more focused on the performance of MySQL in the Azure Cloud. Although I didn’t do any tuning of MySQL parameters, we will see the influence of MySQL Server localization on the latency as well as changes in parameters such as CPU, memory or IOPS on performances using the SysBench tool.
SysBench stress test
Of course there are many tools available to do stress tests. On my side, I decided to use SysBench simply because I know this wonderful free tool and because it is widely deployed. Rather than making a description of SysBench, I simply take a part of its description available on sourceforge that we can find below:
sysbench is a scriptable multi-threaded benchmark tool based on LuaJIT. It is most frequently used for database benchmarks, but can also be used to create arbitrarily complex workloads that do not involve a database server – https://sourceforge.net/projects/sysbench.mirror/, 14.08.2022
Firstly I installed SysBench on my local Ubuntu client (osboxes). After the installation of SysBench but before starting the stress test, we first have to prepare the tables containing the records where the queries will be performed. In the following tests I created 10 tables with 1’000’000 rows in sysbench database (previously created).
osboxes@osboxes:/usr/bin$ sysbench --db-driver=mysql table-size=1000000 --mysql-host=albatroz.mysql.database.azure.com --mysql-port=3306 --mysql-db=sysbench --mysql-user=grs --tables=10 --mysql-password=MyPassword --test=/usr/share/sysbench/oltp_read_write.lua prepareOnce the tables populated, we can run the tests. For the tests, I decided to use oltp_read_write.lua which has a default ratio of read:write 95%:5%.
sysbench --db-driver=mysql --num-threads=8 --mysql-user=grs --mysql-password=MyPassword --mysql-db=sysbench --events=0 --time=100 --test=/usr/share/sysbench/oltp_read_write.lua --mysql-host=albatroz.mysql.database.azure.com --mysql-port=3306 --tables=10 --db-ps-mode=disable --table-size=1000000 --report-interval=10 runI varied the number of threads (num-threads parameter) from 8 to 256, limited the time to 100 seconds and changed two kinds of parameters through the Azure interface during my tests:
- The Server location (East US, vs West Switzerland)
- The Compute and Storage (Compute Tier and IOPS)
It’s important to note that my Client is also located in Western Switzerland to understand the impact of location. You can find below the four configurations I did:
- Server located in US, with minimal compute and storage meaning 1vCore 2Gib Memory and 360 IOPS
- Server located in US, with general purpose configuration meaning 2vCores, 8Gib Memory and 3200 IOPS
- Server located in West Switzerland, with minimal compute and storage meaning 1vCore 2Gib Memory and 360 IOPS
- Server located in West Switzerland, with general purpose configuration meaning 2vCores, 8Gib Memory and 3200 IOPS
Server details
As it’s not possible to change the location of a server afterwards, I created two MySQL servers in same version (version 8.0.28). One located in East US and the other located in West Switzerland. Note that we have two locations in Switzerland (North Switzerland and West Switzerland). As explained above, in order to make comparisons, I provided the same set of resources for tests 1 and 3 and test 2 and 4. Also as specified before, my client is located in Switzerland.
The basic configuration looks like the one below:
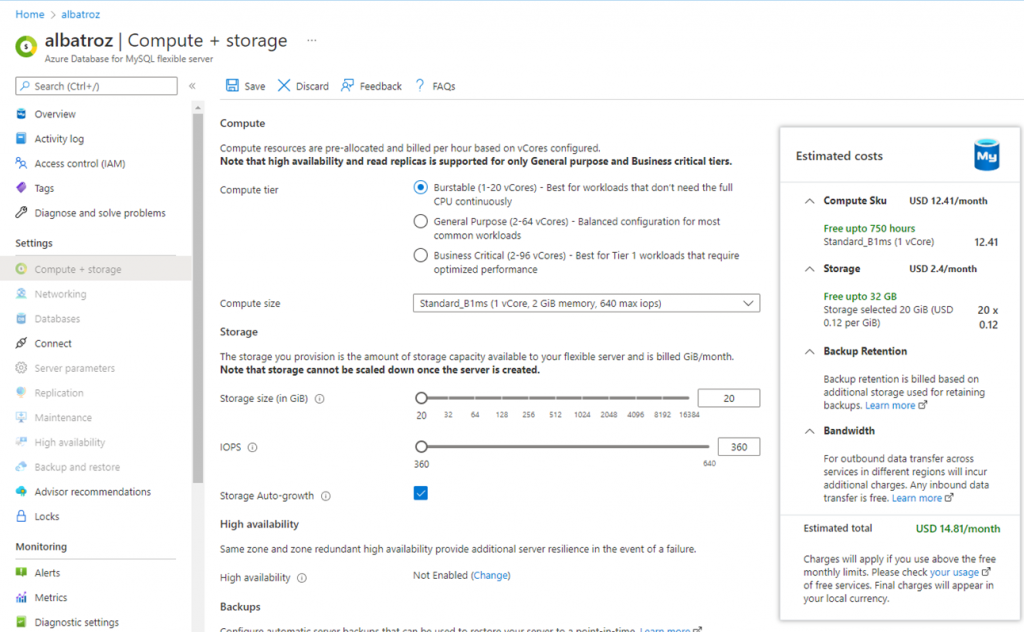
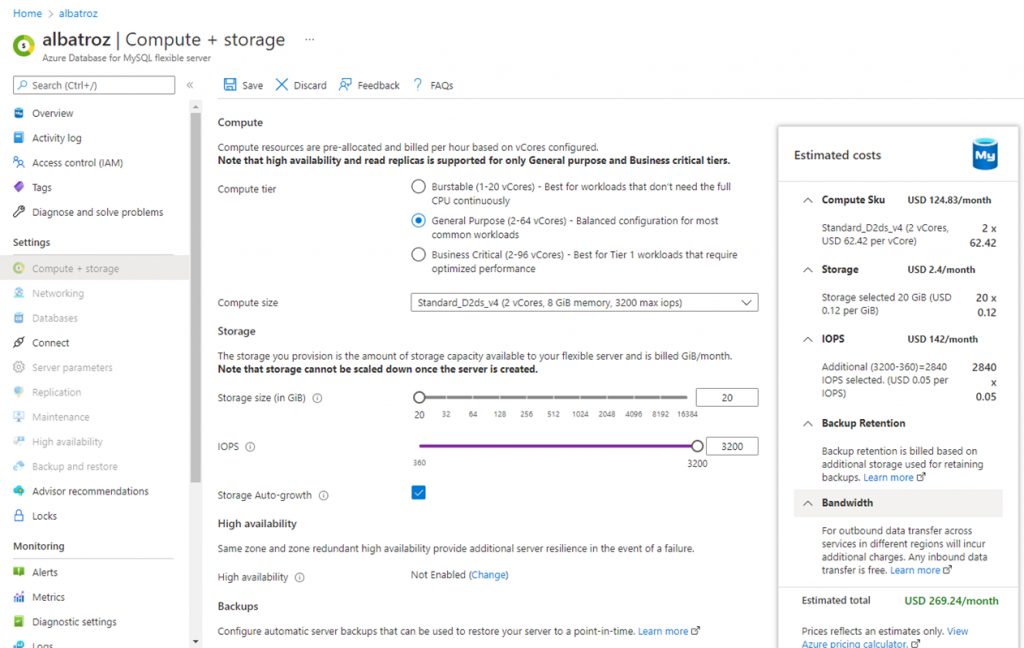
It is worth mentioning that to upgrade the server’s capacity (from Burstable to General Purpose with more IOPS), it only takes about ten minutes maximum. Meaning that when we end with the tests and we want to go to production, we only need few minutes to upgrade the server properties. We can find the description of the upgraded server below as well as the monthly price of this upgraded server.
Let’s run the tests
I executed the same tests with only a variation in the number of thread (from 8 to 256) on each four configurations. We can find an extract of the execution as well as the output below
osboxes@osboxes:/usr/bin$ sysbench --db-driver=mysql  --num-threads=8 --mysql-user=grs --mysql-password=MyPassword --mysql-db=sysbench --events=0 --time=100  --test=/usr/share/sysbench/oltp_read_write.lua --mysql-host=albatroz.mysql.database.azure.com --mysql-port=3306 --tables=10 --db-ps-mode=disable --table-size=1000000 --report-interval=10 run
WARNING: the --test option is deprecated. You can pass a script name or path on the command line without any options.
WARNING: --num-threads is deprecated, use --threads instead
sysbench 1.0.20 (using system LuaJIT 2.1.0-beta3)

Running the test with following options:
Number of threads: 8
Report intermediate results every 10 second(s)
Initializing random number generator from current time


Initializing worker threads...

Threads started!

[ 10s ] thds: 8 tps: 3.20 qps: 77.58 (r/w/o: 55.98/4.40/17.20) lat (ms,95%): 2082.91 err/s: 0.00 reconn/s: 0.00
[ 20s ] thds: 8 tps: 4.00 qps: 72.91 (r/w/o: 50.51/5.00/17.40) lat (ms,95%): 2585.31 err/s: 0.00 reconn/s: 0.00
[ 30s ] thds: 8 tps: 4.00 qps: 77.80 (r/w/o: 53.80/5.30/18.70) lat (ms,95%): 2120.76 err/s: 0.00 reconn/s: 0.00
[ 40s ] thds: 8 tps: 3.20 qps: 72.80 (r/w/o: 52.50/4.50/15.80) lat (ms,95%): 2632.28 err/s: 0.00 reconn/s: 0.00
[ 50s ] thds: 8 tps: 4.00 qps: 78.40 (r/w/o: 55.40/5.10/17.90) lat (ms,95%): 2082.91 err/s: 0.00 reconn/s: 0.00
[ 60s ] thds: 8 tps: 4.00 qps: 73.60 (r/w/o: 49.70/5.40/18.50) lat (ms,95%): 2632.28 err/s: 0.00 reconn/s: 0.00
[ 70s ] thds: 8 tps: 4.00 qps: 77.60 (r/w/o: 53.60/5.00/19.00) lat (ms,95%): 2082.91 err/s: 0.00 reconn/s: 0.00
[ 80s ] thds: 8 tps: 3.20 qps: 73.60 (r/w/o: 54.10/4.70/14.80) lat (ms,95%): 2405.65 err/s: 0.00 reconn/s: 0.00
[ 90s ] thds: 8 tps: 4.00 qps: 77.60 (r/w/o: 53.90/4.80/18.90) lat (ms,95%): 2082.91 err/s: 0.00 reconn/s: 0.00
[ 100s ] thds: 8 tps: 4.00 qps: 73.60 (r/w/o: 49.60/4.80/19.20) lat (ms,95%): 2493.86 err/s: 0.00 reconn/s: 0.00
SQL statistics:
    queries performed:
        read:                            5376
        write:                           501
        other:                           1803
        total:                           7680
    transactions:                        384    (3.78 per sec.)
    queries:                             7680   (75.60 per sec.)
    ignored errors:                      0      (0.00 per sec.)
    reconnects:                          0      (0.00 per sec.)

General statistics:
    total time:                          101.5914s
    total number of events:              384

Latency (ms):
         min:                                 2000.71
         avg:                                 2115.55
         max:                                 2644.11
         95th percentile:                     2585.31
         sum:                               812371.47

Threads fairness:
    events (avg/stddev):           48.0000/0.00
    execution time (avg/stddev):   101.5464/0.07
We can see in this output, that I asked to sysbench to provide me with a feedback every 10 seconds. We can also observe that the ratio between the queries and transaction is respected (95%:5%), finally it can noted that the latency is important in our case (Server in US and client in Switzerland). The average latency in the above example is 2’115.55ms. If we are interested in the latency distribution we can use the option –histogram.
Tests summary
We can find below the summary of the tests I did with the described configurations.
| East US | West Switzerland | |||||||
| 1.Minimal configuration | 2. General purpose | 3.Minimal configuration | 4. General purpose | |||||
| Number of Threads | trans./sec | queries/sec | trans./sec | queries/sec | trans./sec | queries/sec | trans./sec | queries/sec |
| 8 | 3,78 | 75,6 | 3,73 | 74,63 | 27,91 | 559,82 | 28,06 | 561,13 |
| 16 | 7,95 | 150,94 | 7,46 | 149,22 | 54,13 | 1083,58 | 56,04 | 1120,71 |
| 32 | 15,14 | 303,02 | 15,52 | 310,61 | 102,33 | 2047,31 | 105,18 | 2103,62 |
| 64 | 29,1 | 588,85 | 30,74 | 614,91 | 178,78 | 3576 | 167,92 | 3358,82 |
| 128 | 58,87 | 1179,82 | 61,19 | 1225,15 | too many conn. | 191,83 | 3837,11 | |
| 192 | too many conn. | 86,08 | 1722,69 | too many conn. | 176,63 | 3533,02 | ||
| 256 | too many conn. | 107,73 | 2158,16 | too many conn. | 161,66 | 3233,95 | ||
The first thing we can see after having a look on the above table is that whereas we faced a “too many connections” errors with minimal configurations, the tests worked properly with the General purpose configuration.
The second thing that we can observe is that the tests performed better with the server located in West Switzerland. One of the reasons is most probably linked with the latency. Whereas we had an average of 2’100ms of latency for server located in East US, we have an average of 350ms of latency for server located in West Switzerland.
Finally in our configuration, the increase of compute and storage doesn’t show any improvement in terms of transaction per second or queries per second.
Latency between the application and the MySQL Server
The latency is an important parameter to take into consideration. As explained on Microsoft webpage named “Best practices for optimal performance of your Azure Database for MySQL server” to improve the performance of an application, we have to take into consideration the proximity between the MySQL Server and the application.
To improve the performance and reliability of an application in a cost optimized deployment, it’s highly recommended that the web application service and the Azure Database for MySQL resource reside in the same region and availability zone. – Microsoft, 16.08.2022
This page also gives some tips in order to optimize your MySQL performances on Azure. To check the latency, you do not need to use SysBench, a simple query such as the one executed in the below examples presents the latency difference between the execution on a localhost, an Azure server located in Switzerland and an Azure server located in US.
Latency on a Localhost
mysql> select 1;
+---+
| 1 |
+---+
| 1 |
+---+
1 row in set (0.00 sec)
Latency on an Azure Server located in West Switzerland
 MySQL  albatrozswitzerland.mysql.database.azure.com:3306 ssl SQL > select 1;
+---+
| 1 |
+---+
| 1 |
+---+
1 row in set (0.0436 sec)
Latency on an Azure Server located in East US
MySQL albatroz.mysql.database.azure.com:3306 ssl SQL > select 1;
+---+
| 1 |
+---+
| 1 |
+---+
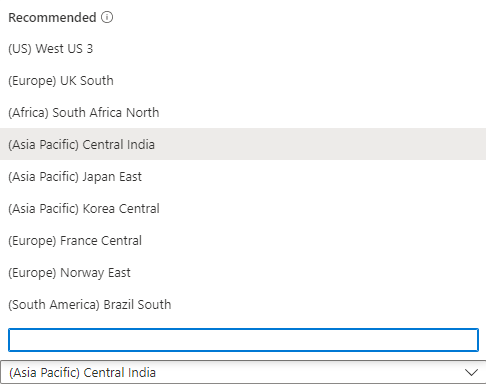
1 row in set (0.1690 sec)Considering only the latency, one could think that the application must be hosted on an Azure server in Switzerland (at least in my case). Unfortunately we will discover that not all services of the Microsoft Azure Cloud are available in Switzerland. For instance if we want to deploy an Ubuntu Server, we will see that only the following location are available:
Performance monitoring
Microsoft Azure provides us with an interface showing the following default graphs (cf screenshot below:
- CPU and Memory
- IO Percent
- DB Connections
- Queries
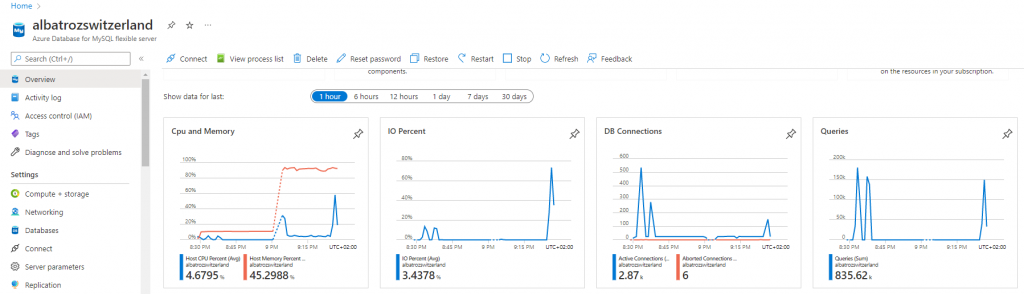
But you can add other information regarding storage, Host network in/out, replication lag, aborted connection, aso…
Conclusion
This short blog regarding the performance of MySQL in the Azure Cloud provides the following conclusions:
The ability to upgrade a MySQL server by adding CPU, disk and memory capacity in a few minutes is really interesting. For instance when you want to switch your test project to production, you simply need to change the servers properties and 10 minutes later, your server is adapted. Additionally, we can always reduce the CPU & Memory capacity as well as the IOPS, only the storage cannot be reduced.
At first glance, it also seems that it is very important to use a MySQL server close to the client for performance reasons (in order to avoid latency issues). Unfortunately depending on the application and business requirements it could be difficult to have the MySQL Server and the Application Server in the same country.
Finally adding CPU, memory and increasing the number of IOPS did not show any improvement in the number of transactions or queries per second in this specific configuration (of course it’s strongly depending on the use case). However, this does not mean that by taking the time to configure the MySQL server correctly, one could not benefit from these additional capacities. Regarding the tuning of MySQL variables, it’s interesting to see that some variables are updated automatically such as the innodb_buffer_pool_size when we change server resources.
![Thumbnail [60x60]](https://www.dbi-services.com/blog/wp-content/uploads/2022/08/GRS_web-min-scaled.jpg)
![Thumbnail [90x90]](https://www.dbi-services.com/blog/wp-content/uploads/2022/08/ADE_WEB-min-scaled.jpg)
![Thumbnail [90x90]](https://www.dbi-services.com/blog/wp-content/uploads/2024/03/AHI_web.jpg)
![Thumbnail [90x90]](https://www.dbi-services.com/blog/wp-content/uploads/2025/07/ALK_MIN.jpeg)
![Thumbnail [90x90]](https://www.dbi-services.com/blog/wp-content/uploads/2025/05/JDE_Web-1-scaled.jpg)