I recently changed ISP, and I wanted to monitor its performance and make sure I get what I’m paying for. I initially started writing a bash script that I was running in a crontab, then writing the results in an md file.
But that’s not very sexy. I wanted something graphical with a nice UI.
It turns out that there is a project called Speedtest-tracker, written and maintained by Alex Justesen on GitHub that does just what I was looking for. Behind the scenes, speedtest-tracker uses the official Ookla CLI.
Speedtest Tracker is a self-hosted application that monitors the performance and uptime of your internet connection. Built using Laravel and Speedtest CLI from Ookla®, deployable with Docker.
The cool thing is that Speedtest Tracker is containerized; you can run it anywhere you want! At first, I had installed it as a Docker container on my Synology, but the NAS I own only has 1Gbps Ethernet ports, and my ISP advertises DL/UL speeds of 5 Gbps / 900 Mbps
I have a mini PC that I use for my YaK projects, which embeds a 2.5Gbps Ethernet card. I’d rather use this machine than the NAS. Even though I will not be able to test the full speed my ISP provides, at least I will be able to see if I get near 2.5Gbps, which is already a great download speed.
OK, enough talking, let’s get our hands dirty and let’s deploy Speedtest-tracker!
Your list of ingredients
Here is what you need to add to your recipe:
- A hypervisor, in my case I’m using Proxmox
- A virtual machine (on which I’m using SUSE Linux, but any distro will work just fine)
- A Kubernetes cluster. Keep it simple, install a single node RKE2
- A persistent volume: local-path provisioner does the job
I’m passing these steps here, but you can find them in my other blog dedicated to installing the YaK, if you need.
Everything is well documented on Speedtest tracker web page
There is already a community manifest available for Kubernetes, written and maintained by Maxime Moreillon.
How to install speedtest-tracker?
Installing speedtest tracker is as simple as deploying 2 yaml files:
- 1 for the postgreSQL database
- 1 for the frontend app
The PG database and the application manifests are available here.
All the credit goes to Maxime Moreillon, who wrote these manifests and made them available to the community.
All I had to do was save the files to my “speedtest” folder and adjust them to my context.
localhost:~ # cd speedtest
localhost:~/speedtest # ls -ltrh
total 8.0K
-rw-r--r-- 1 root root 1.1K Jul 29 16:29 postgres.yaml
-rw-r--r-- 1 root root 2.2K Aug  3 18:48 speedtest-tracker.yaml
My Postgres manifest
I haven’t changed a single line from Maxime Moreillon’s code. The manifest includes the PVC definition, the PostgreSQL deployment itself, and a service:
apiVersion: v1
kind: PersistentVolumeClaim
metadata:
  name: postgres
spec:
  accessModes:
    - ReadWriteOnce
  resources:
    requests:
      storage: 50Gi
---
apiVersion: apps/v1
kind: Deployment
metadata:
  name: postgres
spec:
  replicas: 1
  selector:
    matchLabels:
      app: postgres
  template:
    metadata:
      labels:
        app: postgres
    spec:
      containers:
        - name: postgres
          image: postgres:15.1
          env:
            - name: POSTGRES_PASSWORD
              value: password
            - name: POSTGRES_DB
              value: speedtest_tracker
            - name: POSTGRES_USER
              value: speedy
          volumeMounts:
            - mountPath: /var/lib/postgresql/data
              name: postgres
      volumes:
        - name: postgres
          persistentVolumeClaim:
            claimName: postgres

---
apiVersion: v1
kind: Service
metadata:
  name: postgres
spec:
  ports:
    - port: 5432
  selector:
    app: postgres
  type: ClusterIP
My speedtest-tracker manifest
With a few adjustments from Maxime’s code to fit my needs. It comes with the PVC definition, the application deployment, and the service:
apiVersion: v1
kind: PersistentVolumeClaim
metadata:
  name: speedtest-tracker
spec:
  accessModes:
    - ReadWriteOnce
  resources:
    requests:
      storage: 5Gi
  storageClassName: local-path  # Adjust if you're using a different StorageClass

---
apiVersion: apps/v1
kind: Deployment
metadata:
  name: speedtest-tracker
spec:
  replicas: 1
  revisionHistoryLimit: 0
  selector:
    matchLabels:
      app: speedtest-tracker
  template:
    metadata:
      labels:
        app: speedtest-tracker
    spec:
      containers:
        - name: speedtest-tracker
          image: lscr.io/linuxserver/speedtest-tracker:latest
          ports:
            - containerPort: 80
          env:
            - name: PUID
              value: "1000"
            - name: PGID
              value: "1000"
            - name: DB_CONNECTION
              value: pgsql
            - name: DB_HOST
              value: postgres
            - name: DB_PORT
              value: "5432"
            - name: DB_DATABASE
              value: speedtest_tracker
            - name: DB_USERNAME
              value: speedy
            - name: DB_PASSWORD
              value: password

########MY PERSONAL ENV VARIABLES########
            - name: APP_NAME
              value: home-speedtest-k8s
            - name: APP_KEY
              value: <generate your own app key>
            - name: DISPLAY_TIMEZONE
              value: Europe/Paris
            - name: SPEEDTEST_SERVERS
              value: "62493"
            - name: SPEEDTEST_SCHEDULE
              value: '*/30 * * * *'
            - name: PUBLIC_DASHBOARD
              value: "true"
#########################################

          volumeMounts:
            - mountPath: /config
              name: speedtest-tracker
      volumes:
        - name: speedtest-tracker
          persistentVolumeClaim:
            claimName: speedtest-tracker

---
apiVersion: v1
kind: Service
metadata:
  name: speedtest-tracker
  labels:
    app: speedtest-tracker
spec:
  selector:
    app: speedtest-tracker
  type: NodePort
  ports:
    - name: http
      port: 80
      targetPort: 80
      nodePort: 30080  # You can change this to any port in the 30000-32767 range
Now, generate your own APP KEY and paste the value in the placeholder in the code above (including the base64: prefix), here is how:
echo -n 'base64:'; openssl rand -base64 32;And that’s it!
Once your manifests are ready and once you are happy with the environment variables you want (the list of env. variables is available here), you just need to create your namespace on your cluster and apply the configuration:
kubectl create ns speedtest
kubectl apply -f speedtest/postgres.yaml -n speedtest
kubectl apply -f speedtest/speedtest-racker.yaml -n speedtest
After a few seconds, your pods will come up:
localhost:~/speedtest # kubectl get pods -n speedtest
NAME                                 READY   STATUS    RESTARTS        AGE
postgres-6c8499b968-rbwlw            1/1     Running   2 (4d18h ago)   5d21h
speedtest-tracker-7997cbdc8f-64n7c   1/1     Running   0               19h
Enjoy !
If you did things right, you should be able to monitor your internet speed and display the results on a neat UI. In my case, I fire a speedtest every 30 minutes (I know, that’s overkill, but I just wanted to play a bit. I will reduce the frequency to something more reasonable, I promise 😉 )
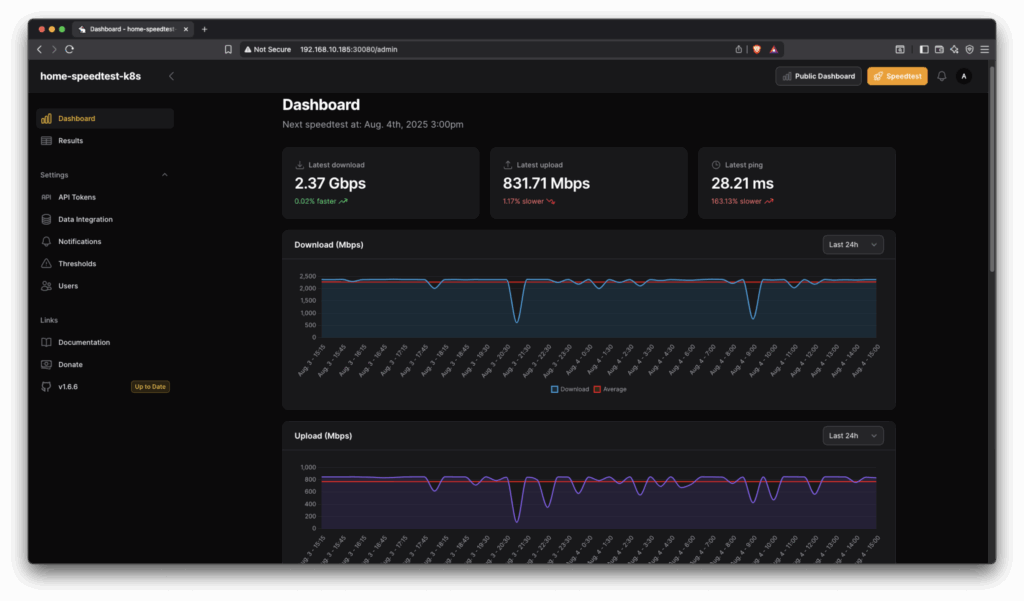
Cool, no?
To go further
I’d love to monitor the full bandwidth my ISP advertises, but I’m limited by my hardware: my router does not support link aggregation, and it only comes with one 10G fiber-optic WAN interface + one 2.5 Gbps and two 1Gbps LAN interfaces. There is no chance I can test the full fiber-optic capacity with this hardware.
In the future, I might buy a switch that supports LACP and configure my router in bridge mode to be able to reach the full WAN bandwidth, or invest in a router that provides more high-speed interfaces. But to be honest, the investment is not really worth it.
One thing I could do however would be to enable HTTPS and add a Let’s Encrypt certificate to secure the connections to my frontend. That’s an improvement I could make soon.
![Thumbnail [60x60]](https://www.dbi-services.com/blog/wp-content/uploads/2022/08/GRE_web-min-scaled.jpg)
![Thumbnail [90x90]](https://www.dbi-services.com/blog/wp-content/uploads/2025/05/martin_bracher_2048x1536.jpg)
![Thumbnail [90x90]](https://www.dbi-services.com/blog/wp-content/uploads/2024/03/AHI_web.jpg)
![Thumbnail [90x90]](https://www.dbi-services.com/blog/wp-content/uploads/2022/08/HER_web-min-scaled.jpg)