Zabbix might not be the first monitoring tool that comes in mind when you want to monitor a Kubernetes cluster (Did you say Prometheus? 🙂 ). Nevertheless, as an open-source project, Zabbix have affinities with others open-source projects.
In this blog post, we will see how easy it is to monitor a Kubernetes cluster with Zabbix.
Monitoring Architecture
As Kubernetes is a container orchestration system for automating software deployment […] (wikipedia), you don’t want to manually install a Zabbix agent on each node of the cluster. With that in mind, Zabbix developed a helm chart to deploy what is required to monitor the cluster:
- A DaemonSet on all cluster nodes for Zabbix agent (one agent per node)
- A single replica deployment for the Zabbix proxy who will act as a collection point for all Zabbix agents
The Zabbix proxy will run in ActiveMode meaning that it will get configuration from Zabbix server and push data to it.
Kubernetes Preparation
Among all the customizable values of the helm chart, the most important is the Zabbix server IP/hostname as Zabbix proxy requires it to push data to Zabbix server:
    - name: ZBX_SERVER_HOST
      value: "192.168.x.y"
Once the chart has been installed in the dedicated monitoring namespace of your Kubernetes cluster, we should be able to see the pods:
$ kubectl get pods -n monitoring
NAME                                         READY   STATUS    RESTARTS   AGE
zabbix-agent-lbwsg                           1/1     Running   0          15m
zabbix-kube-state-metrics-64aac65c45-g9n94   1/1     Running   0          15m
zabbix-proxy-5b4faaff64-xf8wk                1/1     Running   0          15m
Zabbix Web UI
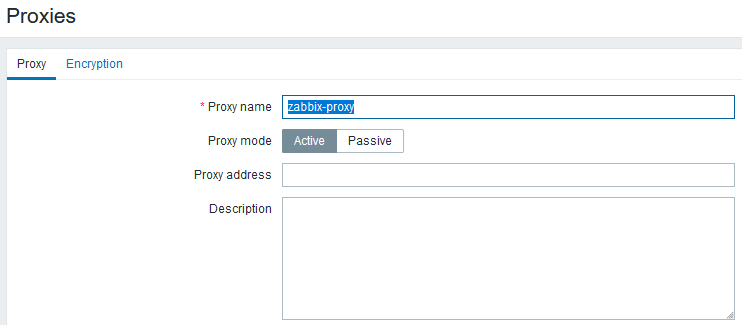
On Zabbix side, we must create the zabbix proxy:
Next, we can create a “fake” host as it does not really correspond to any host. It is just a place holder for the configuration that must be provided to Zabbix proxy:
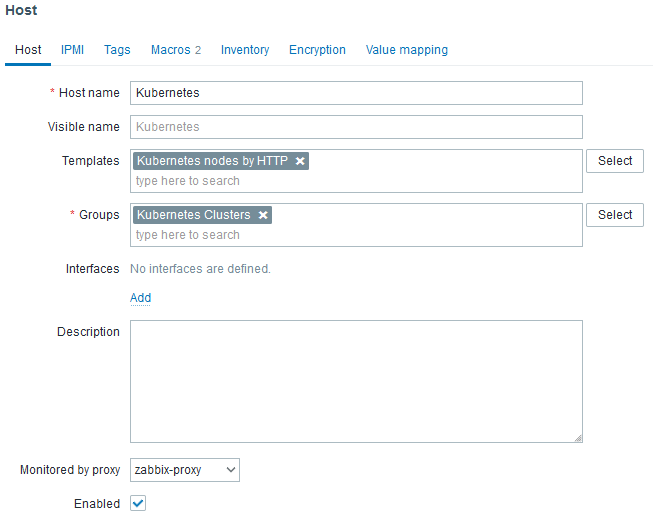
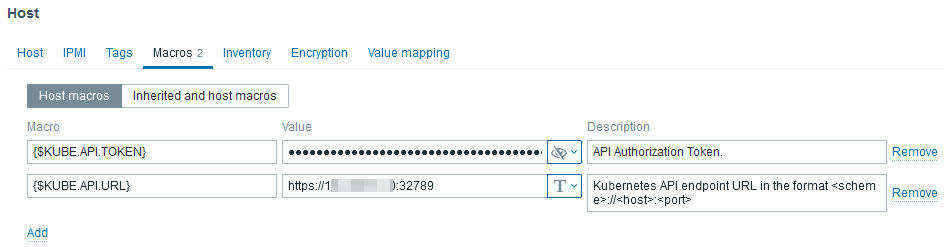
There is no need to set an interface as the selected template will not use it anyway. In the Macros tab, we must set two of them:
- {$KUBE.API.URL}
- {$KUBE.API.TOKEN}
Thus, it will look like this:
After a couple of minutes, you will see a new host with Zabbix agent in green:

The IP 192.168.49.2 is an IP internal the Kubernetes cluster (here provisioned with minikube on a raspberry pi 4).
![Thumbnail [90x90]](https://www.dbi-services.com/blog/wp-content/uploads/2022/08/GRE_web-min-scaled.jpg)
![Thumbnail [90x90]](https://www.dbi-services.com/blog/wp-content/uploads/2022/08/ADE_WEB-min-scaled.jpg)
![Thumbnail [90x90]](https://www.dbi-services.com/blog/wp-content/uploads/2022/08/NME_web-min-scaled.jpg)