We have been doing a lot of tests around Rook Ceph lately for one of our customer and it may worth sharing what I’ve learned. If you want a quick overview on that topic before diving into the official documentation (Rook and Ceph), please read on!
Ceph cluster overview
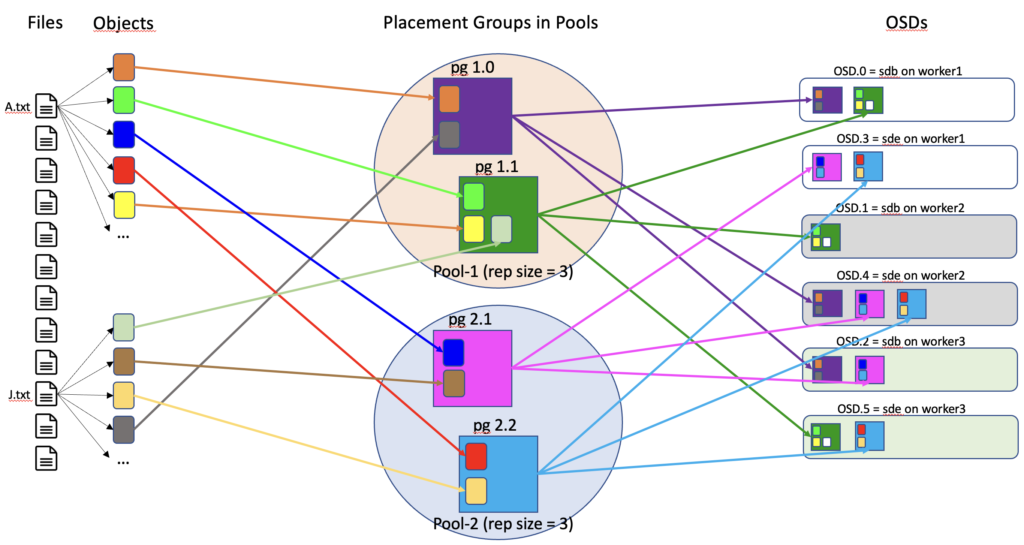
As the adage says “A picture is worth a thousand words” so I’ve drawn an overview of a Ceph cluster:

A Ceph cluster in a nutshell provides a distributed platform for storage with no single point of failure. Different storage format are available and in our case we are using the file system storage of Ceph.
In this cluster, the files created (A.txt and J.txt in my diagram) are converted into several objects. These objects are then distributed into placement groups (pg) which are put into pools.
A pool has some properties configured as how many replicas of a pg will be stored in the cluster (3 by default). Those pg will finally be physically stored into an Object Storage Daemon (OSD). An OSD stores pg (and so the objects within it) and provides access to them over the network.
With this simple example you can see how my files are represented and distributed into a Ceph cluster. When we want to read one of those files, the Ceph cluster will gather all the objects of a replica of all involved pg and reconvert them to my file.
The Ceph cluster has another piece of configuration that makes the replicas split on separate physical equipment for maximum redundancy. Ceph maintains a view of the objects in their storage location with what is called the CRUSH (Controlled Replication Under Scalable Hashing) maps.
You may think from this introduction that it is a bit complicated. It is indeed and we’ve only scratched the surface of it! Let’s see now how a Ceph storage can work with Rook.
This is Rook
To put it simply, Rook uses Kubernetes in order to operate a Ceph cluster. This means that the Ceph cluster components are containerised instead of running on dedicated servers.
With Rook, the OSD storage for example is not a server anymore (like in a pure Ceph cluster) but a Pod that runs in the Kubernetes cluster. Below is an example of those containerised Ceph components into Pods in the namespace rookceph:
[benoit@master ~]$ kubectl get pods -n rookceph
NAME                                                              READY   STATUS      RESTARTS   AGE
csi-cephfsplugin-5mbnx                                            2/2     Running     0          37d
csi-cephfsplugin-m7b89                                            2/2     Running     0          37d
csi-cephfsplugin-m8wdx                                            2/2     Running     0          37d
csi-cephfsplugin-provisioner-5f7d54d68d-cwvrp                     5/5     Running     0          37d
csi-cephfsplugin-provisioner-5f7d54d68d-sdj5x                     5/5     Running     0          37d
csi-cephfsplugin-rlfjx                                            2/2     Running     0          37d
csi-cephfsplugin-vtmr8                                            2/2     Running     0          2d1h
csi-rbdplugin-8nb5w                                               2/2     Running     0          37d
csi-rbdplugin-cdxhz                                               2/2     Running     0          37d
csi-rbdplugin-jkrkk                                               2/2     Running     0          37d
csi-rbdplugin-provisioner-66fd796cd5-s9lzb                        5/5     Running     0          37d
csi-rbdplugin-provisioner-66fd796cd5-z7xph                        5/5     Running     0          3d20h
csi-rbdplugin-sfwmg                                               2/2     Running     0          2d1h
csi-rbdplugin-t5g7b                                               2/2     Running     0          37d
rook-ceph-crashcollector-c2lwpq                                   1/1     Running     0          37d
rook-ceph-crashcollector-9c2g84                                   1/1     Running     0          37d
rook-ceph-crashcollector7kr7bg                                    1/1     Running     0          46h
rook-ceph-crashcollector759w9z                                    1/1     Running     0          37d
rook-ceph-crashcollector-7k6fxw                                   1/1     Running     0          37d
rook-ceph-mds-ceph-filesystem-a-9767c7685-hrzj9                   1/1     Running     0          37d
rook-ceph-mds-ceph-filesystem-b-797f8479d9-x8b7b                  1/1     Running     0          37d
rook-ceph-mgr-a-7795ff9bf4-dzd5l                                  2/2     Running     0          37d
rook-ceph-mgr-b-56668d6486-h6r5q                                  2/2     Running     0          3d20h
rook-ceph-mon-a-749d9ffbf8-kspmh                                  1/1     Running     0          46h
rook-ceph-mon-b-7899645c7d-tfdqp                                  1/1     Running     0          37d
rook-ceph-mon-c-d456fd79-q6w55                                    1/1     Running     0          37d
rook-ceph-operator-fc86ff756-v9bgm                                1/1     Running     0          46h
rook-ceph-osd-0-7f969fd7c5-ghvvt                                  1/1     Running     0          37d
rook-ceph-osd-1-5d4c77c99b-nzv2t                                  1/1     Running     0          37d
rook-ceph-osd-3-649446655d-47vk8                                  1/1     Running     0          37d
rook-ceph-osd-4-5d46d99997-x8nfc                                  1/1     Running     0          37d
rook-ceph-osd-6-75c6699d67-6cvzs                                  1/1     Running     0          46h
rook-ceph-osd-7-5b4b7664b6-wxcfv                                  1/1     Running     0          46h
rook-ceph-osd-prepare-worker1-56zr9                               0/1     Completed   0          8h
rook-ceph-osd-prepare-worker2-fx9tq                               0/1     Completed   0          8h
rook-ceph-osd-prepare-worker3-jg47k                               0/1     Completed   0          8h
rook-ceph-rgw-ceph-objectstore-a-86845499bc-skbdb                 1/1     Running     0          37d
rook-ceph-tools-9967d64b6-7b4cz                                   1/1     Running     0          37d
rook-discover-dx6ql                                               1/1     Running     0          37d
rook-discover-tqhr4                                               1/1     Running     0          2d1h
rook-discover-wlsj2                                               1/1     Running     0          37d
Wouaw it is crowded in there! Let’s introduce a few of them:
- rook-ceph-mds-ceph-filesystem-… Metadata Server Pods. Manage file metadata when CephFS is used to provide file services
- rook-ceph-mgr-… Manager Pods. Act as an endpoint for monitoring, orchestration, and plug-in modules
- rook-ceph-mon-… Monitor Pods. Maintain maps of the cluster state
- rook-ceph-operator-… Operator Pod. Basically installs the basic Ceph components as Pods
- rook-ceph-osd-… OSD Pods. Check its own state and the state of other OSDs and reports back to monitors
- rook-ceph-tools-… Toolbox Pod. Contains the Ceph administration tools to interact with the Ceph cluster
MDS and MGR Pods are deployed by pair for redundancy purpose. MON Pods are deployed by at least 3 and are in odd numbers as a quorum will be established to elect one of them. This provides redundancy as well as high availability.
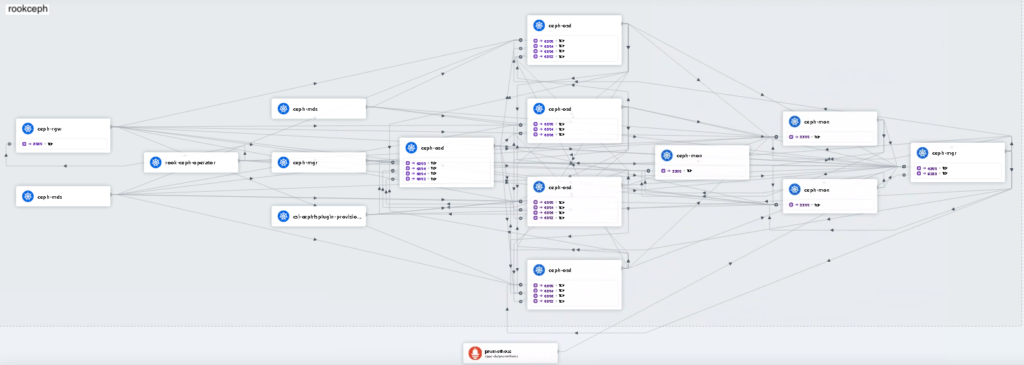
We are using Cillium as CNI (Container Network Interface) in our Kubernetes cluster and so we can monitor the traffic in our rookceph namespace with Hubble UI:

You can have a glimpse of the communications between all those Rook Ceph Pods and so have a visual picture of your Rook Ceph cluster. It is complex indeed!
First contact with our Rook Ceph cluster
When all the Pods are up and running, we can use the toolbox Pod to check our Ceph cluster as in the example below:
[benoit@master ~]$ kubectl -n rookceph exec -it deploy/rook-ceph-tools -- ceph status
  cluster:
    id:     0d086ce1-3691-416b-98cc-e9c12170538f
    health: HEALTH_OK

  services:
    mon: 3 daemons, quorum a,b,c (age 47h)
    mgr: a(active, since 3d), standbys: b
    mds: 1/1 daemons up, 1 hot standby
    osd: 6 osds: 6 up (since 47h), 6 in (since 47h)
    rgw: 1 daemon active (1 hosts, 1 zones)

  data:
    volumes: 1/1 healthy
    pools:   12 pools, 337 pgs
    objects: 56.80k objects, 39 GiB
    usage:   121 GiB used, 479 GiB / 600 GiB avail
    pgs:     337 active+clean

  io:
    client:   310 KiB/s rd, 659 KiB/s wr, 3 op/s rd, 54 op/s wr
You can run these ceph commands directly from the master node or you could also run a bash shell in the toolbox Pod instead and then enter your ceph commands there. I’m using the first method in the example above.
You can see from this output the status of our Ceph cluster as well as the status of all its components. From the quick introduction of this blog you’ll already be able to understand most of them, mission accomplished!
As a conclusion, let’s see an useful command that gives us a view of our OSDs, their distribution as well as their storage capacity and usage:
[benoit@master ~]$ kubectl -n rookceph exec -it deploy/rook-ceph-tools -- ceph osd df tree
ID  CLASS  WEIGHT   REWEIGHT  SIZE     RAW USE  DATA     OMAP     META     AVAIL    %USE   VAR   PGS  STATUS  TYPE NAME
-1         0.58612         -  600 GiB  122 GiB  117 GiB  153 MiB  5.1 GiB  478 GiB  20.35  1.00    -          root default
-5         0.19537         -  200 GiB   40 GiB   39 GiB   57 MiB  1.4 GiB  160 GiB  20.22  0.99    -              host worker1
 0    hdd  0.09769   1.00000  100 GiB   24 GiB   23 GiB  7.0 MiB  738 MiB   76 GiB  23.72  1.17  169      up          osd.0
 4    hdd  0.09769   1.00000  100 GiB   17 GiB   16 GiB   50 MiB  737 MiB   83 GiB  16.73  0.82  168      up          osd.3
-3         0.19537         -  200 GiB   41 GiB   39 GiB   35 MiB  1.8 GiB  159 GiB  20.37  1.00    -              host worker2
 1    hdd  0.09769   1.00000  100 GiB   18 GiB   17 GiB   23 MiB  836 MiB   82 GiB  17.74  0.87  189      up          osd.1
 3    hdd  0.09769   1.00000  100 GiB   23 GiB   22 GiB   12 MiB  967 MiB   77 GiB  23.00  1.13  148      up          osd.4
-7         0.19537         -  200 GiB   41 GiB   39 GiB   61 MiB  1.9 GiB  159 GiB  20.44  1.00    -              host worker3
 6    hdd  0.09769   1.00000  100 GiB   22 GiB   21 GiB   29 MiB  848 MiB   78 GiB  21.78  1.07  163      up          osd.2
 7    hdd  0.09769   1.00000  100 GiB   19 GiB   18 GiB   33 MiB  1.0 GiB   81 GiB  19.09  0.94  174      up          osd.5
                       TOTAL  600 GiB  122 GiB  117 GiB  153 MiB  5.1 GiB  478 GiB  20.35
MIN/MAX VAR: 0.82/1.17  STDDEV: 2.64
You can link this output to the overview diagram of Ceph at the beginning of this blog. We can now explain our storage configuration through the OSDs. We have 3 worker nodes that are dedicated to Rook Ceph storage. Each worker has 2 hard disks (sdb and sde with 100GB each) that are used for this storage. So from the storage point of view, one OSD equals one disk and there is one pg replica per worker (on one of its disk). This distribution has been done thanks to the CRUSH maps I’ve mentioned earlier. If we lose one disk or one worker, we will still hold at least two replicas of our pg and by default the pool is configured to continue to operate in this state. The Ceph cluster will be in a degraded status but fully functional.
In a next blog I’ll share an exemple of administration task you may have to perform in a Rook Ceph cluster. Stay tuned!
![Thumbnail [90x90]](https://www.dbi-services.com/blog/wp-content/uploads/2022/08/ADE_WEB-min-scaled.jpg)
![Thumbnail [90x90]](https://www.dbi-services.com/blog/wp-content/uploads/2022/08/NME_web-min-scaled.jpg)
![Thumbnail [90x90]](https://www.dbi-services.com/blog/wp-content/uploads/2022/08/GRE_web-min-scaled.jpg)