By Franck Pachot
.
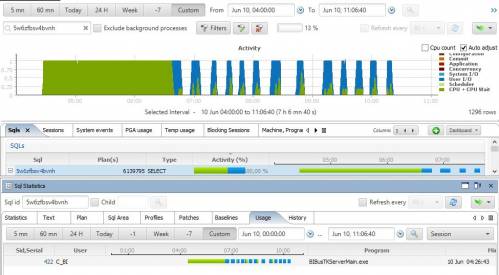
Most of my performance stores start with a screenshot of Orachrome Lighty my preferred tool to have a graphical view of the database performance, in Standard and Enterprise Edition without any options:
I’m investigating a long running query. That query obeys to the most important rule in Oracle performance: parce once (CPU) – execute many (IO+CPU) … except that the parse time is a bit too long here (2 hours)
How to know what happens ? ASH is there if you have Diagnostic Pack:
MIN(SAMPLE_TIME)  MAX(SAMPLE_TIME)  COUNT(*) PLAN_LINE_ID SESSION_STATE IN_PARSE IN_SQL_EXECUTION
----------------- -------------------------- ------------ ------------- -------- ----------------
10.06.15 04:26:43 10.06.15 05:29:41     3773              ON CPU        Y        N
10.06.15 05:21:26 10.06.15 06:37:43     4078              ON CPU        Y        Y
10.06.15 06:37:44 10.06.15 10:14:54       34           26 WAITING       N        Y
10.06.15 06:37:53 10.06.15 10:15:38      707           32 WAITING       N        Y
10.06.15 06:38:49 10.06.15 10:15:46      106           33 WAITING       N        Y
10.06.15 06:38:57 10.06.15 10:15:42       18           28 ON CPU        N        Y
10.06.15 06:38:59 10.06.15 09:44:13        5           25 ON CPU        N        Y
and this is where I know that those 2 hours on CPU are for parsing. No SQL_PLAN_LINE_ID at parse phase. I’ve no explanation yet about the hour that is accounted both as parse and execution. Comments below are there for ideas 😉
Ok, it’s in CPU. Then let’s go to flame graphs:
perf record -e cpu-cycles -o /tmp/perf.out -g -p 3708
^C
[ perf record: Woken up 1207 times to write data ]
[ perf record: Captured and wrote 301.689 MB /tmp/perf.out (~13180986 samples) ]
perf script -i /tmp/perf.out | ./FlameGraph-master/stackcollapse-perf.pl > /tmp/perf.folded
./FlameGraph-master/flamegraph.pl /tmp/perf.folded > /tmp/perf.folded.svg
cp /tmp/perf.folded.svg .
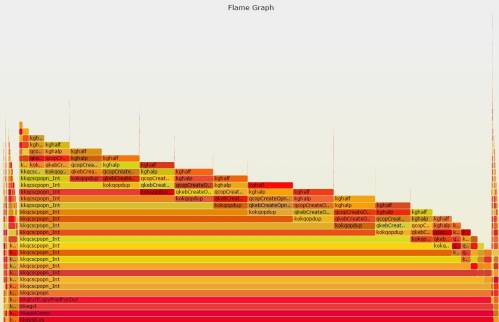
Here is the .svg opened with a browser:
When the parsing time is in hours, we are obvously encountering a bug. So let’s search on MOS for: kghalf kghalp kokqopdup and bingo – several bugs about high CPU usage. Workaround is to disable Simple View Merging.
I have a workaround now – disabling simple view merging. Parse time is short. But query is still running for one hour…
This blog post was about using perf and flame graphs to get the stack from several samples, rather than taking few stack dumps. Those are great tools.


![Thumbnail [60x60]](https://www.dbi-services.com/blog/wp-content/uploads/2022/12/oracle-square.png)
![Thumbnail [90x90]](https://www.dbi-services.com/blog/wp-content/uploads/2025/05/JDE_Web-1-scaled.jpg)
![Thumbnail [90x90]](https://www.dbi-services.com/blog/wp-content/uploads/2022/08/MAW_web-min-scaled.jpg)