Do you know this query language? No, it’s time to explain you and see what it is.
“A Kusto query is a read-only request to process data and return results.” dixit Microsoft Documentation here
The KQL is very simple to understand and use. I can do it then you can also do it! 😛
The first thing to know is how to call the information on a table.
In this case you need to call the table directly with the name of the table, in the place to do a SELECT * FROM Table.
Microsoft give us the opportunity to test it directly on Azure Data Explorer here
In my example, I will use the table Covid19 and I just write the name of the table to have all information:
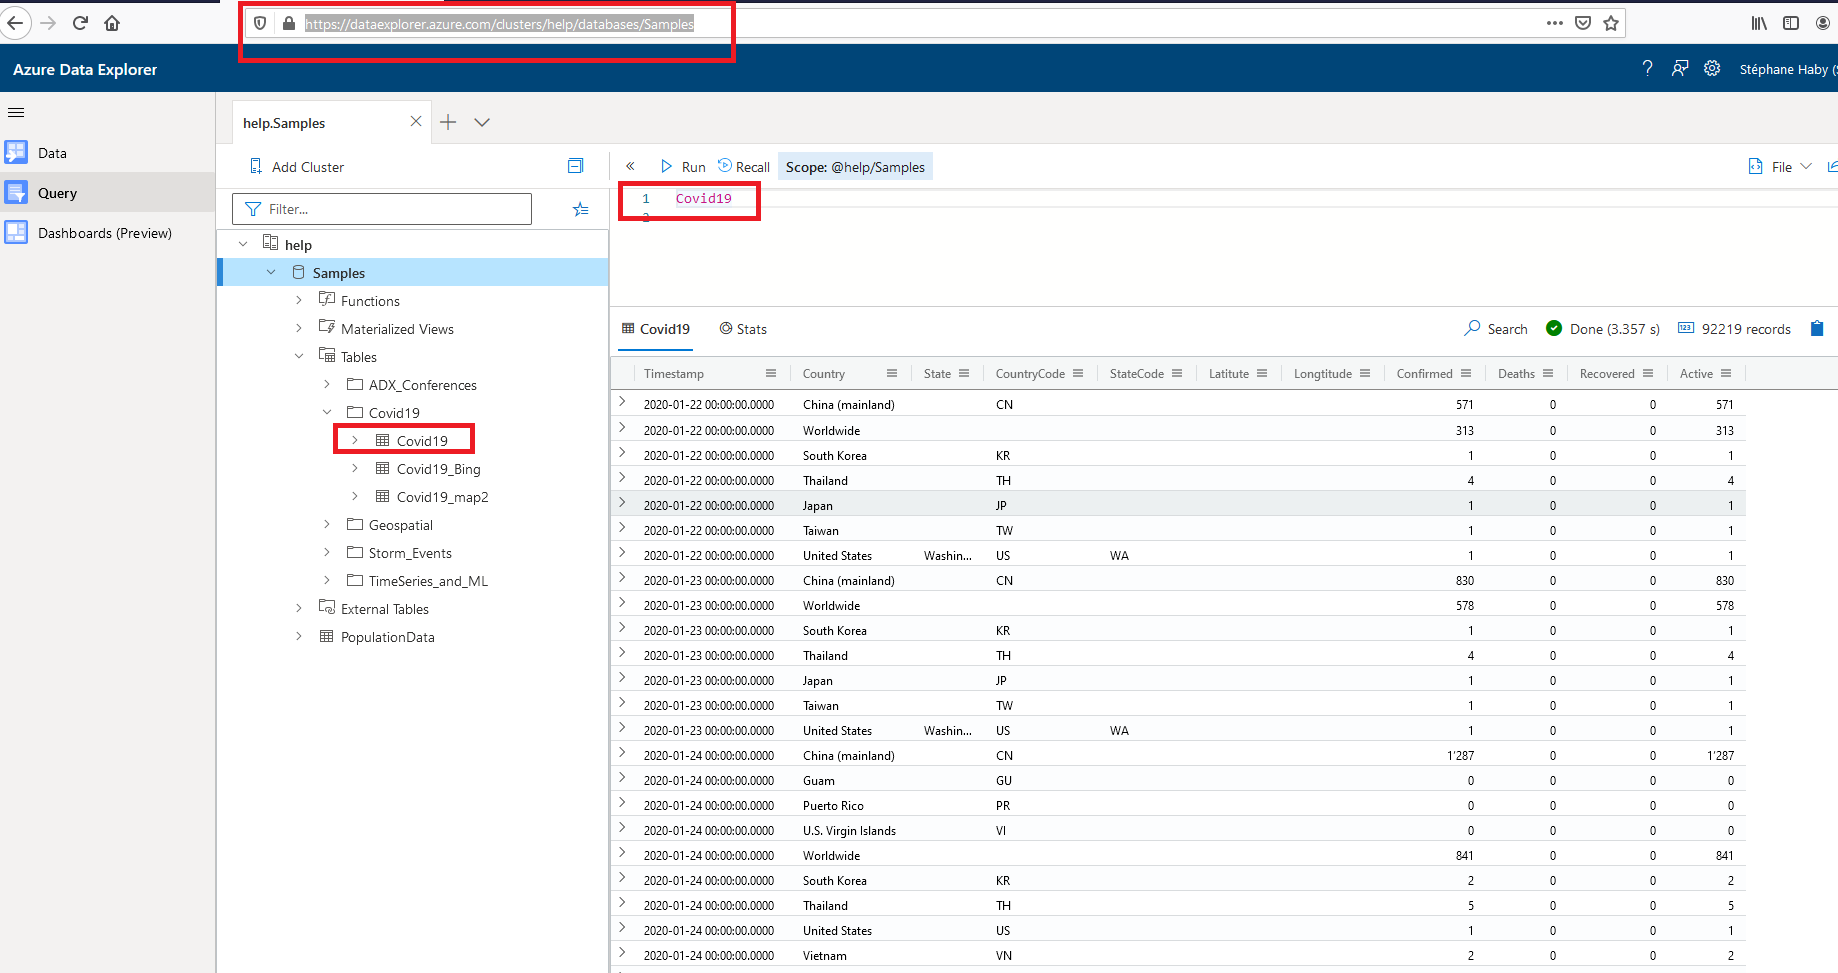
Using the pipe (|) delimiter, I add filters, transformations etc…
My first test is to add a clause WHERE in the query:
Covid19

| where CountryCode == 'CH'
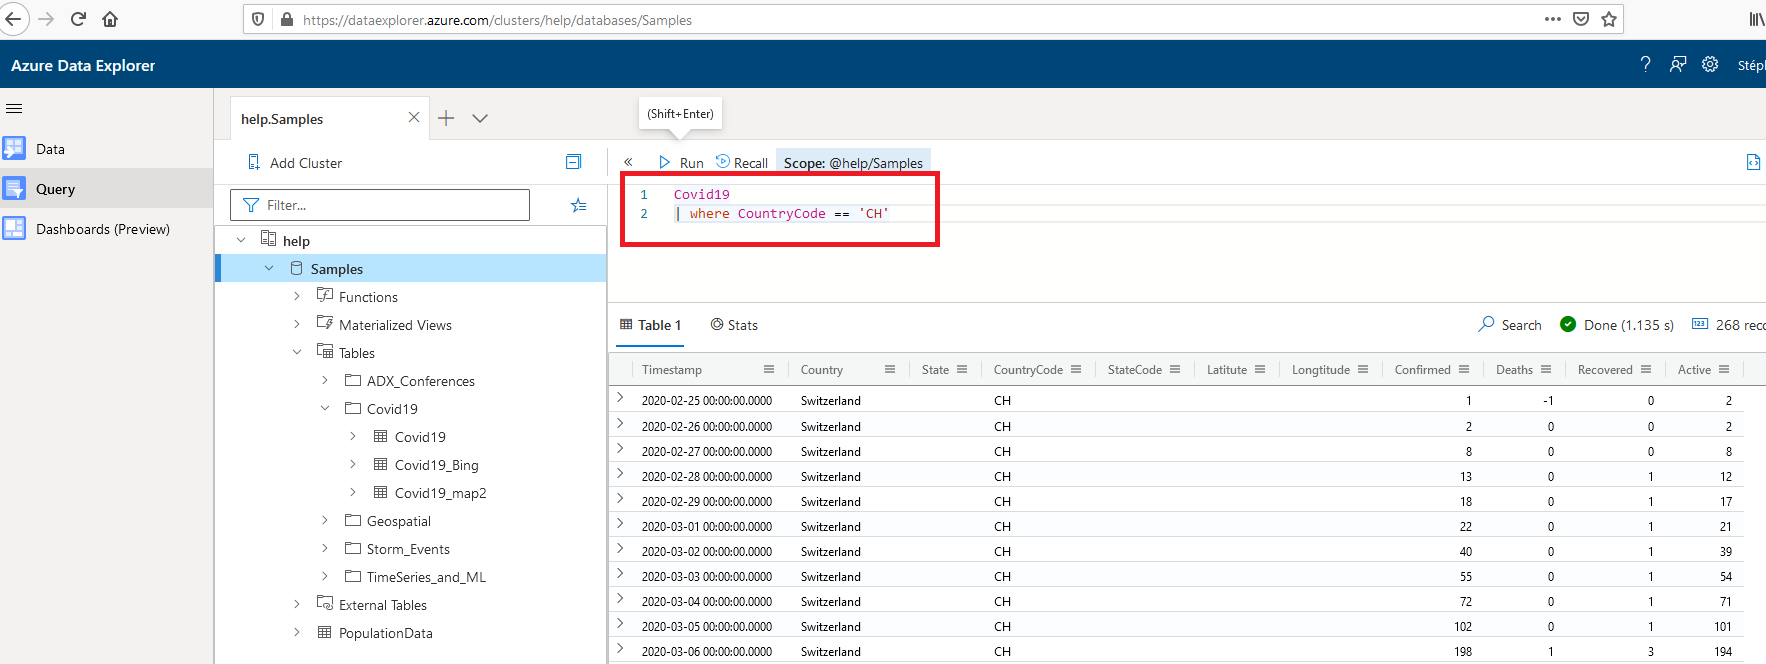
I have all rows for Switzerland now.
When you begin, i advise you to take a look on the query best practices page and have directly the good practice here.
To filter on some columns, you need to add “Project” in the query:
Covid19
| where CountryCode == 'CH'
| project Timestamp, Country, Confirmed, Deaths

The next step is to order the result and it’s easy with an “order by”
Covid19
| where CountryCode == 'CH'
| project Timestamp, Country, Confirmed, Deaths
| order by Deaths desc
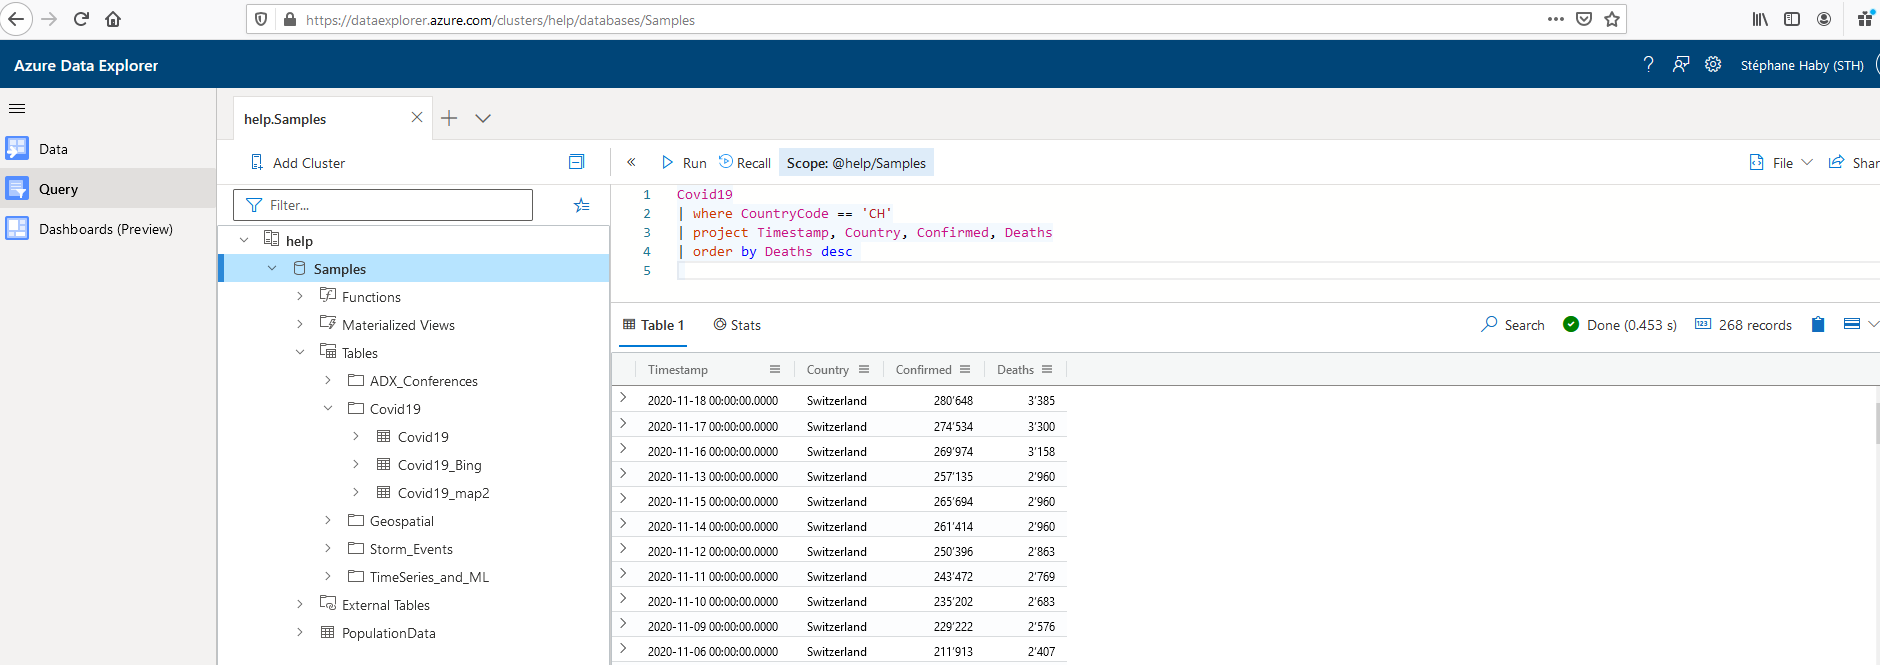
Very easy, it’s it!
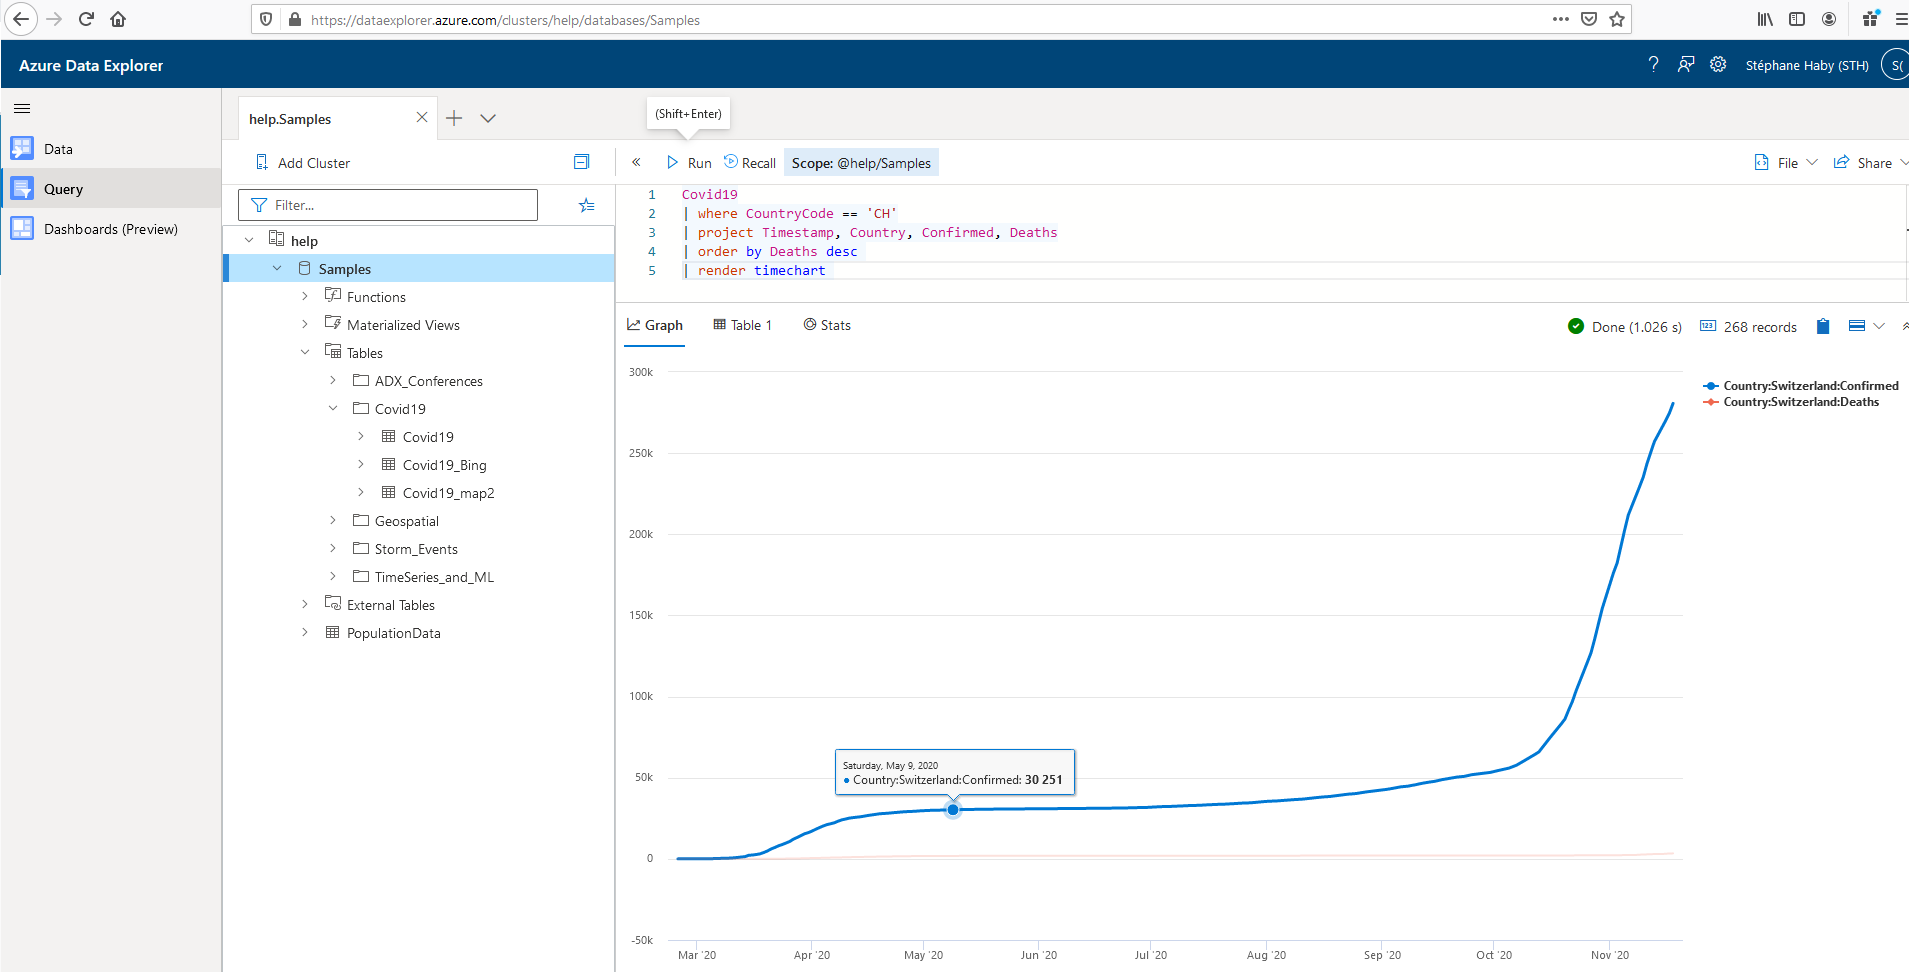
The last step for this first approach is to present the result in a graph.
For this step, you will use the command render and with the intellisense, you have a lot of possibility
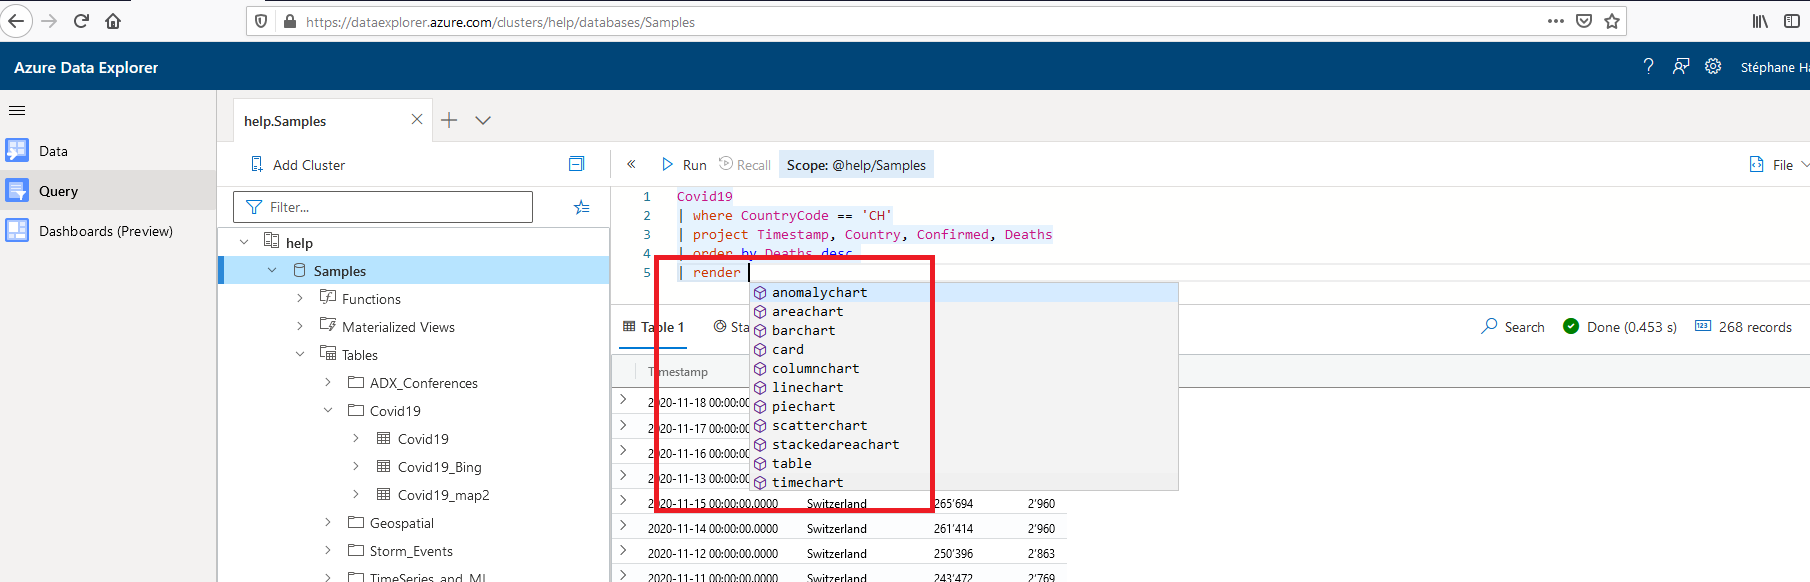
I choose the TimeChart to have the progression during the period:
Covid19
| where CountryCode == 'CH'
| project Timestamp, Country, Confirmed, Deaths
| order by Deaths desc
| render timechart
Et voila, I do my first step in KQL!
Easy to understand, easy to learn, easy to use, easy to have a quick overview of your data…
![Thumbnail [60x60]](https://www.dbi-services.com/blog/wp-content/uploads/2022/08/STH_web-min-scaled.jpg)
![Thumbnail [90x90]](https://www.dbi-services.com/blog/wp-content/uploads/2022/08/NAC_web-min-scaled.jpg)
![Thumbnail [90x90]](https://www.dbi-services.com/blog/wp-content/uploads/2025/05/martin_bracher_2048x1536.jpg)
![Thumbnail [90x90]](https://www.dbi-services.com/blog/wp-content/uploads/2022/08/DWE_web-min-scaled.jpg)