When we talk about setting up infrastructure, there comes the point where we need to ask ourselves about its reliability and robustness. The same applies to monitoring, which is why it’s totally normal to wonder about the solutions offered by Prometheus.
For example, is it possible to implement high availability with Prometheus? And what should we do when Prometheus starts showing signs of fatigue? Would deploying a new Prometheus server be enough, or would we risk becoming scattered with an accumulation of servers?
These are the kinds of questions that I’ll be exploring in this post. So, let’s dive in and see what we can learn!
High Availability
First things first, let’s tackle the question of high availability.
Unlike Alertmanager, which allows clustering and communication between multiple instances, Prometheus doesn’t extend the same privilege. However, the truth is, clustering Prometheus is not needed to achieve high availability. This tool has been ingeniously engineered to maintain high availability without requiring server communication.
In fact, setting up a highly available Prometheus system is a breeze just by running multiple Prometheus servers with identical configurations.

Without further ado, I’ll explain how to set up this HA in a few steps, if you don’t mind.
Let’s assume that we have two Prometheus servers, Prometheus_DC1 and Prometheus_DC2.
To set up the HA, we have to copy all Prometheus configurations from Prometheus_DC1 to Prometheus_DC2 :
- Copy the Prometheus configuration file
/etc/prometheus/prometheus.ymlfrom the Prometheus_DC1 to Prometheus_DC2. - Copy the rules configuration
/etc/prometheus/rules/rules.yamlfrom the Prometheus_DC1 to Prometheus_DC2 - On Prometheus_DC2, enable the Prometheus service, and start it.
sudo systemctl enable prometheus
sudo systemctl start prometheus
And that’s it. We don’t need anything else to configure HA at the Prometheus level. If we wish, we can add a load balancer configured in round-robin. It can be helpful if we’re using Grafana.
Federation
When we start monitoring with Prometheus, we typically begin with one server per datacenter or environment, which is sufficient due to its efficiency and lower failure rates. However, as operational overhead and performance issues arise, it may be necessary to split the Prometheus server into separate servers for network, infrastructure, and application monitoring, known as vertical sharding. Teams can also run their own Prometheus servers for greater flexibility and control over target labels and scrape intervals. Social factors often lead to Prometheus servers being split before performance concerns arise.
But how do we aggregate all this data?
To perform global aggregations, federation allows for a global Prometheus server to pull aggregated metrics from datacenter Prometheus servers. This ensures reliability and simplicity in monitoring systems, particularly for graphing and alerting purposes.
We can easily share our metric data with Federation across different Prometheus servers.
For informational purposes, there are two types of Federation
- Hierarchical Federation
This means we have bigger Prometheus servers that collect time-series data from smaller ones. We have a top-down approach where data is gathered from different levels.

- Cross-Service Federation
This method involves one Prometheus server monitoring a particular service or group of services, gathering specific time-series data from another server that is monitoring a different set of services.
By doing this, we can run queries and alerts on the merged data from both servers.

Implementing a hierarchical Federation
For this blog, we will assume a configuration with two servers to be monitored – one in Basel and the other in Zurich, each hosting a node_exporter.
These servers will be monitored by dedicated Prometheus servers named dc1 and dc2, respectively. Finally, the metrics from these two Prometheus servers will be aggregated by a federation server.

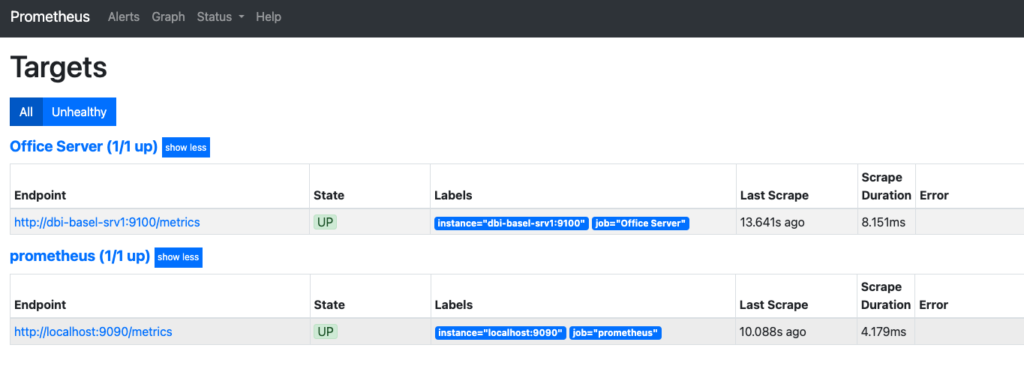
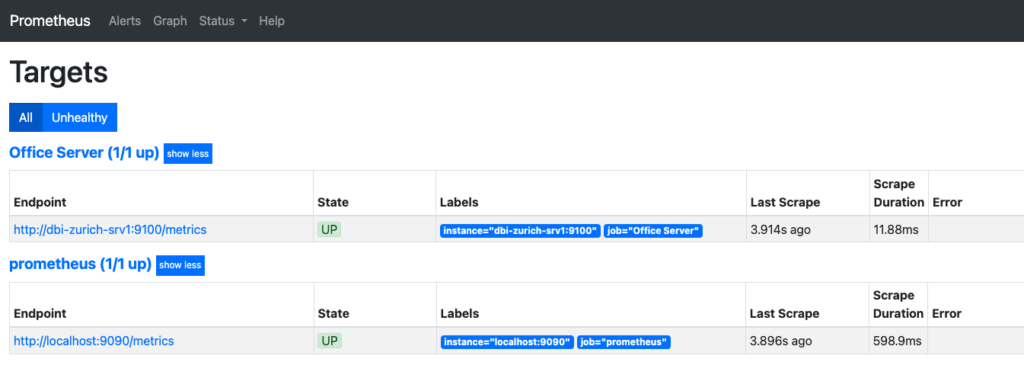
From the Prometheus user interface, we can observe that the “Office Server” jobs gather metrics from the Basel and Zurich servers through their respective endpoints http:/dbi-basel-srv1:9100/metrics and http:/dbi-zurich-srv1:9100/metrics, via the Prometheus servers DC1 and DC2.
Prometheus DC1:
Prometheus DC2:
Now, we can log in to our third Prometheus server (the Federate one) and edit the Prometheus configuration file /etc/prometheus/prometheus.yml.
Add the following block at the bottom of the file, just after the static configuration of the “Prometheus” job name.
# Federation configuration
  - job_name: 'federation'
    scrape_interval: 15s
    honor_labels: true
    metrics_path: '/federate'
    params:
      'match[]':
        - '{job!~"prometheus"}'
    static_configs:
    - targets:
      - 'prometheus-dc-1:9090'
      - 'prometheus-dc-2:9090'
The configuration file should look like below:
# my global config
global:
  scrape_interval:     15s # Set the scrape interval to every 15 seconds. Default is every 1 minute.
  evaluation_interval: 15s # Evaluate rules every 15 seconds. The default is every 1 minute.
  # scrape_timeout is set to the global default (10s).

# Alertmanager configuration
alerting:
  alertmanagers:
  - static_configs:
    - targets:
      # - alertmanager:9093

# Load rules once and periodically evaluate them according to the global 'evaluation_interval'.
rule_files:
  # - "first_rules.yml"
  # - "second_rules.yml"

# A scrape configuration containing exactly one endpoint to scrape:
# Here it's Prometheus itself.
scrape_configs:
  # The job name is added as a label `job=<job_name>` to any timeseries scraped from this config.
  - job_name: 'prometheus'

    # metrics_path defaults to '/metrics'
    # scheme defaults to 'http'.

    static_configs:
    - targets: ['localhost:9090']

# Federation configuration
  - job_name: 'federation'
    scrape_interval: 15s
    honor_labels: true
    metrics_path: '/federate'
    params:
      'match[]':
        - '{job!~"prometheus"}'
    static_configs:
    - targets:
      - 'prometheus-dc-1:9090'
      - 'prometheus-dc-2:9090'
Once configured, we enable the Federal Prometheus Server
sudo systemctl enable prometheus
And start Prometheus
sudo systemctl start prometheus
We can access Federal Prometheus Server through the web UI at http://<Federated Prometheus Server Public IP>:9090.
Then, click on status and finally on target.
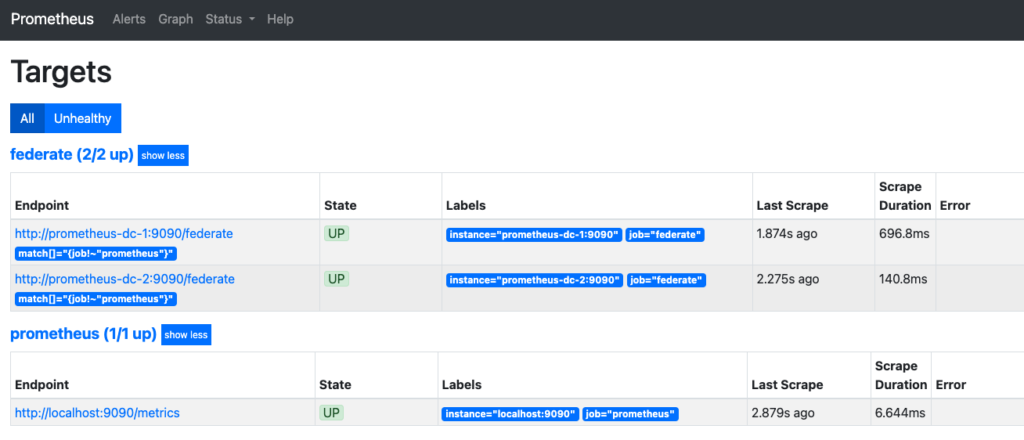
Under the job named ‘federate’, we see that our two Prometheus servers have been scrapped appropriately.
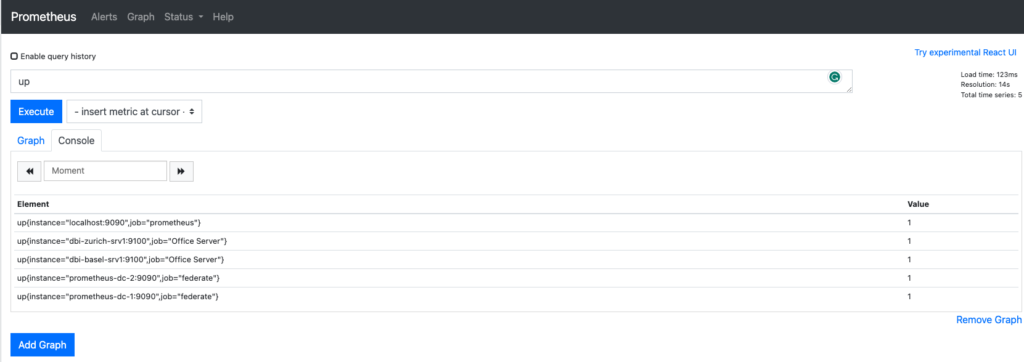
Now we can go to the expression browser and type the command up. It should display the instance from the Basel and Zurich Servers.
Now we know how to set up HA, which can be easily combined with Federation. One doesn’t prevent the other.
The ball is in your court.
![Thumbnail [90x90]](https://www.dbi-services.com/blog/wp-content/uploads/2025/05/martin_bracher_2048x1536.jpg)
![Thumbnail [90x90]](https://www.dbi-services.com/blog/wp-content/uploads/2024/03/AHI_web.jpg)
![Thumbnail [90x90]](https://www.dbi-services.com/blog/wp-content/uploads/2022/08/HER_web-min-scaled.jpg)
jijo.milestogo
07.08.2023Good Article, one query - if we have 1000 node exporters per DC , can the Main Prometheus server (federation) handle the load