By Franck Pachot
.
 Having a database in the cloud is very nice. You add storage with a few clicks. You don’t have to think about the storage type (DAS, SAN, NAS), size of disks, stripe size, SSD, etc. But do you have the performance you expect? I’ve tested I/O in the Cloud that just opened for Europe, so that I get an image of performance when nobody’s there.
SLOB
If you want to test IOPS, the tool is Kevin Closson SLOB of course. It’s easy to setup, and I detailed that in the SLOB in the Cloud.
I have a VM with a 100GB storage attached to it. The storage was defined as ‘latency’ which definition is recommended for low latency and high IOPS, such as for storing database files according to documentation. As of now, I’ve no (official) idea about the storage that is behind.
I run SLOB with default options except the scale that fit the maximum I have on that VM:
UPDATE_PCT=25
RUN_TIME=300
WORK_LOOP=0
#SCALE=500M
SCALE=90000M
WORK_UNIT=64
REDO_STRESS=LITE
LOAD_PARALLEL_DEGREE=4
Optimized for latency
So here is the result for the storage optimized for latency:
column event format a30
set linesize 120 pagesize 1000
select event,wait_time_micro,wait_count,wait_time_format from v$event_histogram_micro
 where event like 'db file sequential read' order by event,wait_time_micro;
EVENT                          WAIT_TIME_MICRO WAIT_COUNT WAIT_TIME_FORMAT
------------------------------ --------------- ---------- ------------------------------
db file sequential read                      1          0 1 microsecond
db file sequential read                      2          0 2 microseconds
db file sequential read                      4          0 4 microseconds
db file sequential read                      8          0 8 microseconds
db file sequential read                     16          0 16 microseconds
db file sequential read                     32          0 32 microseconds
db file sequential read                     64          0 64 microseconds
db file sequential read                    128          0 128 microseconds
db file sequential read                    256         27 256 microseconds
db file sequential read                    512     390619 512 microseconds
db file sequential read                   1024     172914 1 millisecond
db file sequential read                   2048       3387 2 milliseconds
db file sequential read                   4096       1709 4 milliseconds
db file sequential read                   8192       1237 8 milliseconds
db file sequential read                  16384         96 16 milliseconds
db file sequential read                  32768         56 32 milliseconds
db file sequential read                  65536          4 65 milliseconds
db file sequential read                 131072          0 131 milliseconds
db file sequential read                 262144          1 262 milliseconds
On average, this is what we can call ‘low latency’. Let’s look at the detail.
Most of I/O come between 256µs and 512µs. That may suggest data was cached in the array behind Fiber Channel (roundtrip on FC being around 240µs). Nothing below shows that nothing is cached on the server.
That may be an effect of my small amount of data (reading within 9000MB in 5 minutes) and the fact that there is not a lot of activity on that Cloud yet. We will see in the future how it evolves. A small part of I/O is within the mechanical disks latency (> 4ms for 15000 RPM)
Default storage
I’ve run the same workload with a ‘default’ storage witch is recommended by documentation for all other than datafiles.
EVENT                          WAIT_TIME_MICRO WAIT_COUNT WAIT_TIME_FORMAT
------------------------------ --------------- ---------- ------------------------------
db file sequential read                      1          0 1 microsecond
db file sequential read                      2          0 2 microseconds
db file sequential read                      4          0 4 microseconds
db file sequential read                      8          0 8 microseconds
db file sequential read                     16          0 16 microseconds
db file sequential read                     32          0 32 microseconds
db file sequential read                     64          0 64 microseconds
db file sequential read                    128          0 128 microseconds
db file sequential read                    256         22 256 microseconds
db file sequential read                    512     285811 512 microseconds
db file sequential read                   1024     188620 1 millisecond
db file sequential read                   2048       2776 2 milliseconds
db file sequential read                   4096       1533 4 milliseconds
db file sequential read                   8192       1424 8 milliseconds
db file sequential read                  16384       1552 16 milliseconds
db file sequential read                  32768        606 32 milliseconds
db file sequential read                  65536        182 65 milliseconds
db file sequential read                 131072         52 131 milliseconds
db file sequential read                 262144         10 262 milliseconds
From there I don’t see a big difference, except that the I/O that are in the range of mechanical disks seem to take longer. Do we hit there a storage that is more busy and have I/O calls in queue?
Filesystem cache
While I’m on these tests, and following Stefan Koehler comment (https://twitter.com/OracleSK/status/636904162802958336) I tested the same with the ext4 filesystem (filesystemio_options=none) and here it is:
EVENT                          WAIT_TIME_MICRO WAIT_COUNT WAIT_TIME_FORMAT
------------------------------ --------------- ---------- ------------------------------
db file sequential read                      1          0 1 microsecond
db file sequential read                      2          0 2 microseconds
db file sequential read                      4          0 4 microseconds
db file sequential read                      8        562 8 microseconds
db file sequential read                     16      10458 16 microseconds
db file sequential read                     32       6460 32 microseconds
db file sequential read                     64       1053 64 microseconds
db file sequential read                    128        451 128 microseconds
db file sequential read                    256         41 256 microseconds
db file sequential read                    512     126705 512 microseconds
db file sequential read                   1024     338407 1 millisecond
db file sequential read                   2048      14425 2 milliseconds
db file sequential read                   4096        863 4 milliseconds
db file sequential read                   8192        187 8 milliseconds
db file sequential read                  16384         80 16 milliseconds
db file sequential read                  32768         87 32 milliseconds
db file sequential read                  65536         19 65 milliseconds
db file sequential read                 131072          2 131 milliseconds
db file sequential read                 262144          1 262 milliseconds
db file sequential read                 524288          1 524 milliseconds
We clearly see two groups here. Filesystem cache hits around 16 microseconds and array head cache at the additional Fiber Channel transfer time.
Comparison and guesses
I’ve put that in Excel. The maximum number of IO done in 5 minutes are with the ‘latency’ storage (remember, latency here means ‘low latency’).
When using the filesystem cache, a few IO are much quicker with no need to go to the array, but the remaining ones are a bit longer. It looks like the most read blocks that were serve the faster by the array are now served from the server (I’ve about 10GB for filesystem cache).
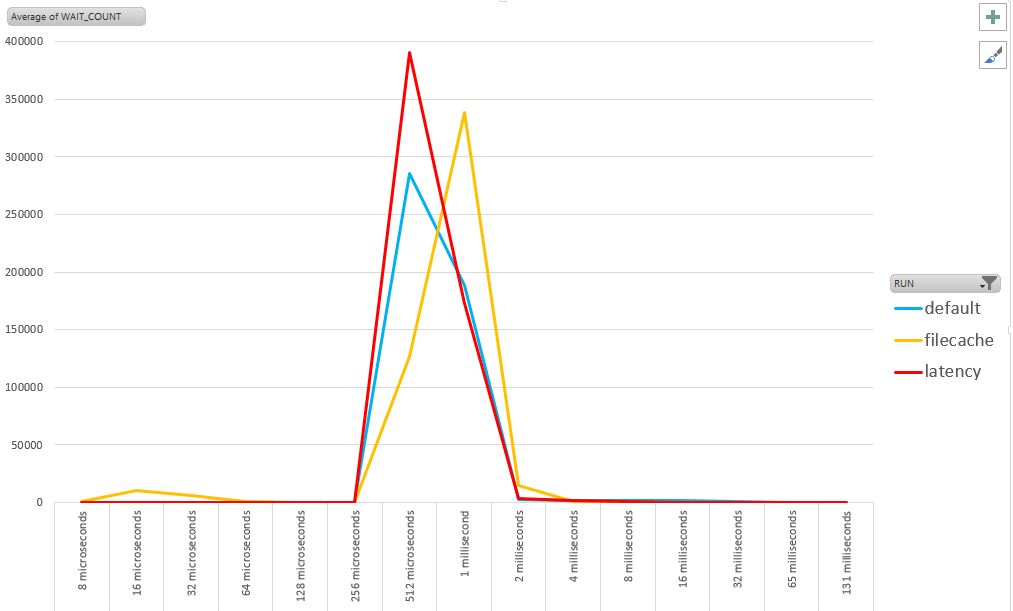
The peak for ‘default’ and ‘latency’ which are at the same place suggest that there is similar FC and head cache. Maybe the only difference is the disk speed?
Here is the same with a logarithmic scale in order to see the outliers better. It’s not enough to get good IOPS average. We don’t want to be the user that suffers from 100ms I/Os.
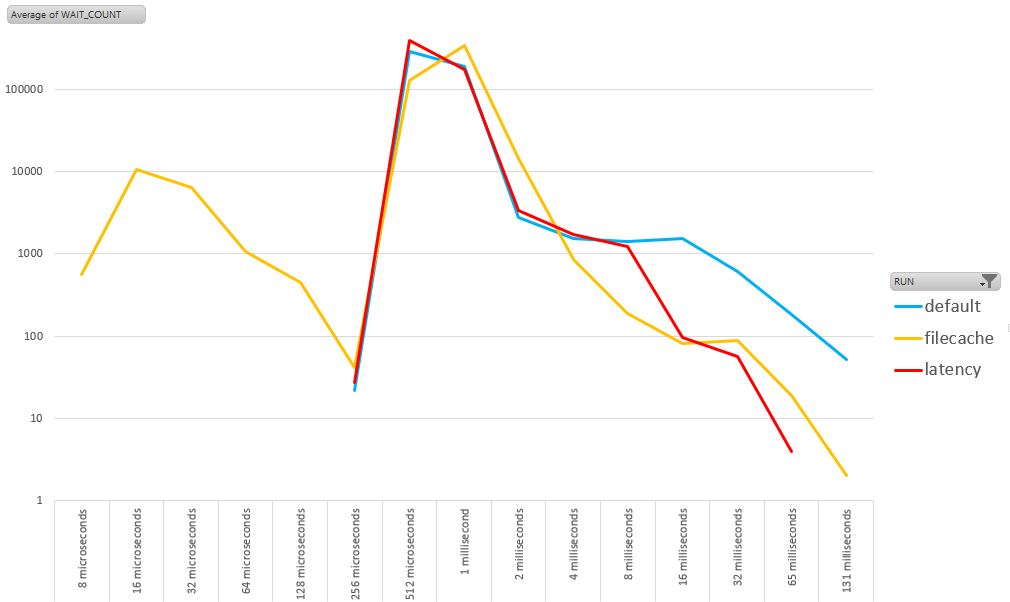
The shape of ‘default’ and ‘latency’ is similar for what is in cache. But for those in the range of mechanic disks, the ‘latency’ outperforms ‘default. So, follow the recommendation: use ‘latency’ for databases.
I’ve no explanation yet (comments welcome) why when using filecache we have less I/Os in the range of 2-8ms. filecache concerns the most frequently read blocks, so they should be in array cache when there is not filesystem cache.
So what?
What’s the point measuring a workload that fit all in cache? You have here the baseline of the maximum IOPS performance you can get from the Database Cloud Services. But be careful. When your data set is larger than those 100GB and the cloud is busy, most of your I/O will be above 1ms, but, it’s still good performance. That’s for a future post. I’ll keep an eye especially on those I/O in the 8-32ms.
![Thumbnail [60x60]](https://www.dbi-services.com/blog/wp-content/uploads/2022/12/oracle-square.png)
![Thumbnail [90x90]](https://www.dbi-services.com/blog/wp-content/uploads/2022/08/MAW_web-min-scaled.jpg)
![Thumbnail [90x90]](https://www.dbi-services.com/blog/wp-content/uploads/2025/11/LTO_WEB.jpg)
![Thumbnail [90x90]](https://www.dbi-services.com/blog/wp-content/uploads/2025/05/JDE_Web-1-scaled.jpg)