By Franck Pachot
.
I recently installed Percona Monitoring & Management on AWS (free tier) and here is how to monitor an instance on another cloud (OCI), in order to show which TCP port must be opened.
PMM server
I installed PMM from the AWS Marketplace, following those instructions: https://www.percona.com/doc/percona-monitoring-and-management/deploy/server/ami.html. I’ll not reproduce the instructions, just some screenshots I took during the install:

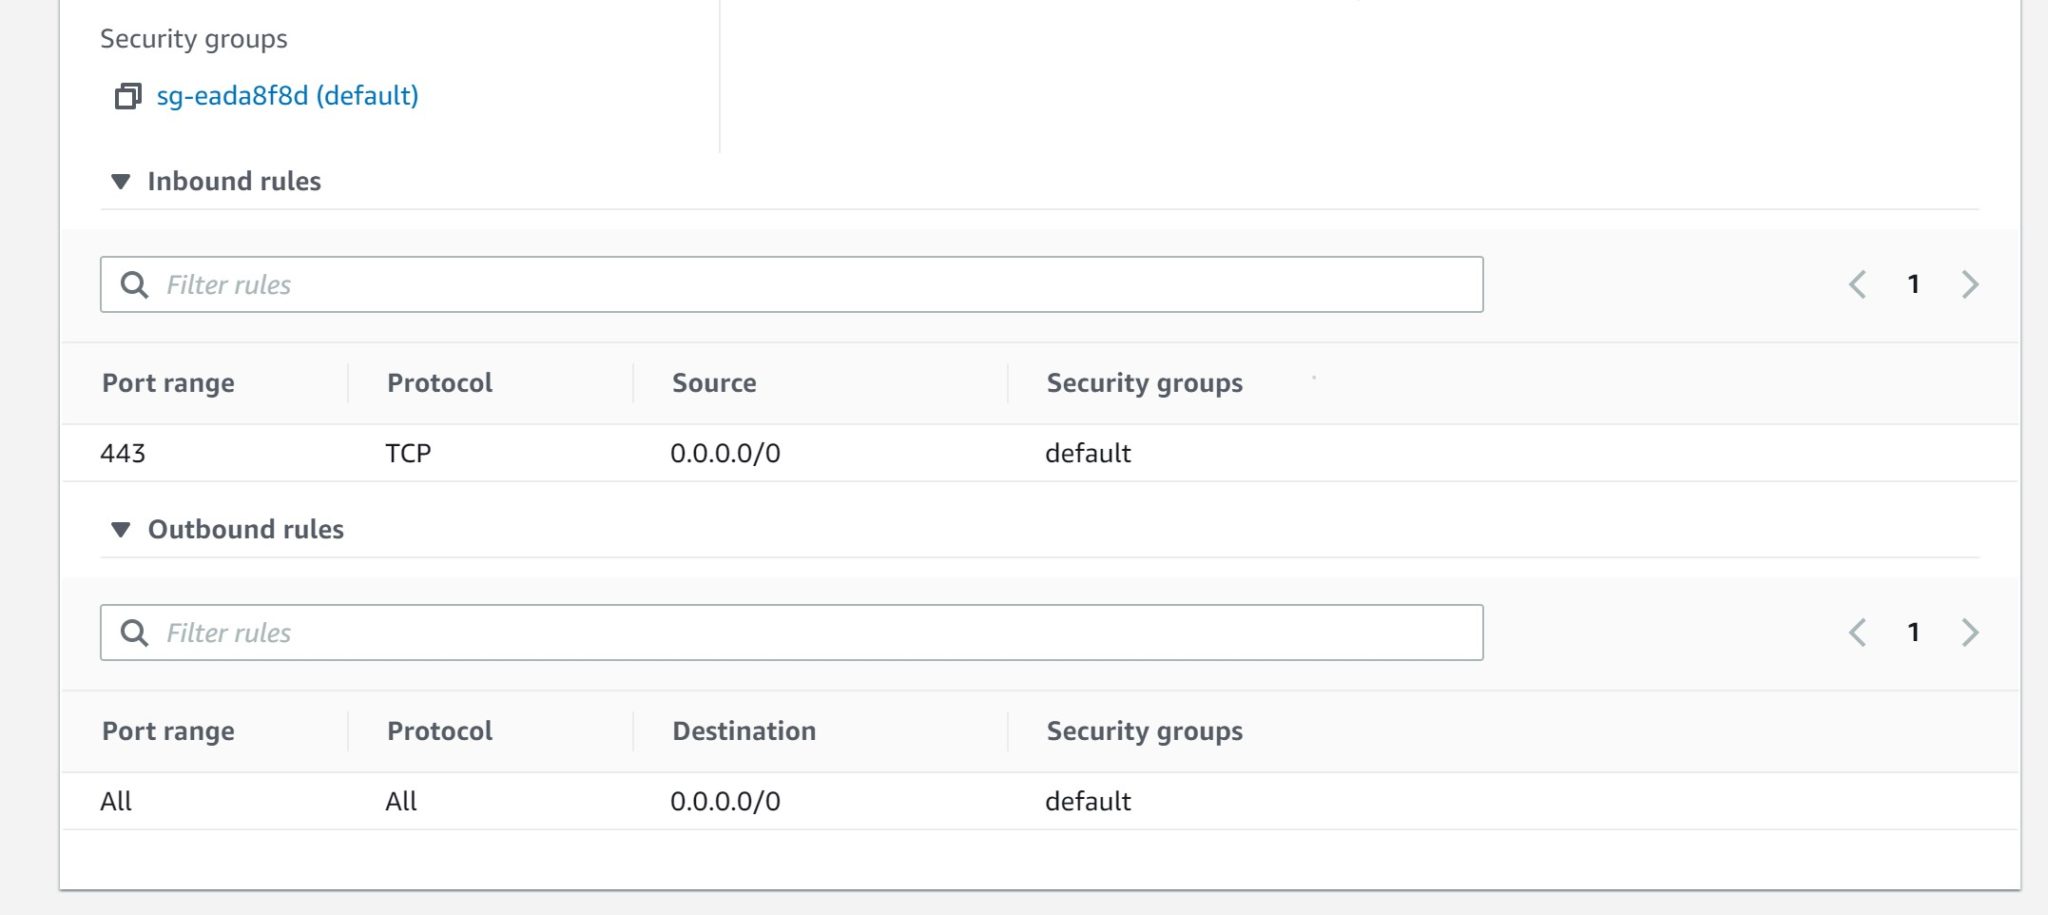
I have opened the HTTPS port in order to access the console, and also configure the clients which will also connect through HTTPS (but I’m not using a signed certificate).
Once installed, two targets are visible: the PMM server host (Linux) and database (PostgreSQL):
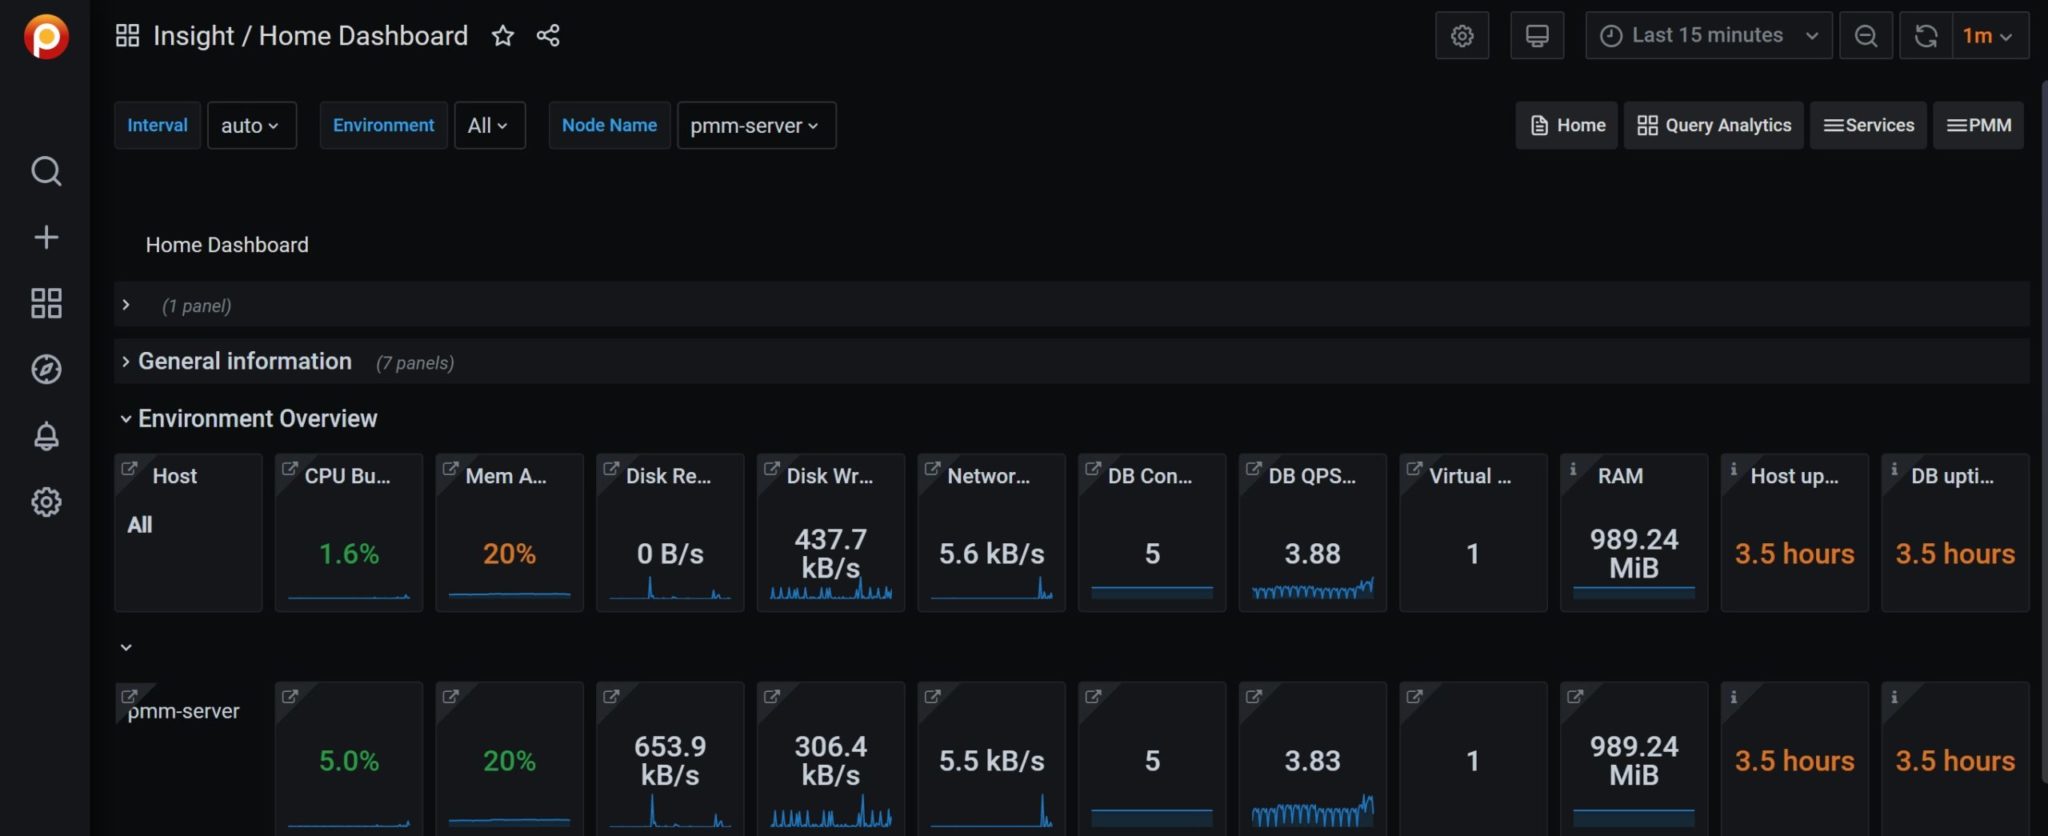
Note that I didn’t secure HTTPS here and I’ll have to accept insecure SSL.
PMM client
I’ll monitor an Autonomous Linux instance that I have on Oracle Cloud (Free Tier). Autonomous Linux is based on OEL, which is based on RHEL (see https://www.dbi-services.com/blog/al7/) and is called “autonomous” because it updates the kernel without the need to reboot. I install the PMM Client RPM:
[opc@al ~]$ sudo yum -y install https://repo.percona.com/yum/percona-release-latest.noarch.rpm


Loaded plugins: langpacks
percona-release-latest.noarch.rpm                                                                        |  19 kB  00:00:00
Examining /var/tmp/yum-root-YgvokG/percona-release-latest.noarch.rpm: percona-release-1.0-25.noarch
Marking /var/tmp/yum-root-YgvokG/percona-release-latest.noarch.rpm to be installed
Resolving Dependencies
--> Running transaction check
---> Package percona-release.noarch 0:1.0-25 will be installed
--> Finished Dependency Resolution
al7/x86_64                                                                                               | 2.8 kB  00:00:00
al7/x86_64/primary_db                                                                                    |  21 MB  00:00:00
epel-apache-maven/7Server/x86_64                                                                         | 3.3 kB  00:00:00
ol7_UEKR5/x86_64                                                                                         | 2.5 kB  00:00:00
ol7_latest/x86_64                                                                                        | 2.7 kB  00:00:00
ol7_x86_64_userspace_ksplice                                                                             | 2.8 kB  00:00:00

Dependencies Resolved

Dependencies Resolved

================================================================================================================================
 Package                        Arch                  Version               Repository                                     Size
================================================================================================================================
Installing:
 percona-release                noarch                1.0-25                /percona-release-latest.noarch                 31 k

Transaction Summary
================================================================================================================================
Install  1 Package

Total size: 31 k
Installed size: 31 k
Downloading packages:
Running transaction check
Running transaction test
Transaction test succeeded

Running transaction
  Installing : percona-release-1.0-25.noarch                                                                                1/1
* Enabling the Percona Original repository
 All done!
* Enabling the Percona Release repository
 All done!
The percona-release package now contains a percona-release script that can enable additional repositories for our newer products.

For example, to enable the Percona Server 8.0 repository use:

  percona-release setup ps80

Note: To avoid conflicts with older product versions, the percona-release setup command may disable our original repository for some products.

For more information, please visit:
  https://www.percona.com/doc/percona-repo-config/percona-release.html

  Verifying  : percona-release-1.0-25.noarch                                                                                1/1

Installed:
  percona-release.noarch 0:1.0-25
This packages helps to enable additional repositories. Here, I need the PMM 2 Client:
[opc@al ~]$ sudo percona-release enable pmm2-client


* Enabling the PMM2 Client repository
 All done!
Once enabled, it is easy to install it with YUM:
[opc@al ~]$ sudo yum install -y pmm2-client


Loaded plugins: langpacks
percona-release-noarch                                                                                   | 2.9 kB  00:00:00
percona-release-x86_64                                                                                   | 2.9 kB  00:00:00
pmm2-client-release-x86_64                                                                               | 2.9 kB  00:00:00
prel-release-noarch                                                                                      | 2.9 kB  00:00:00
(1/4): percona-release-noarch/7Server/primary_db                                                         |  24 kB  00:00:00
(2/4): pmm2-client-release-x86_64/7Server/primary_db                                                     | 3.5 kB  00:00:00
(3/4): prel-release-noarch/7Server/primary_db                                                            | 2.5 kB  00:00:00
(4/4): percona-release-x86_64/7Server/primary_db                                                         | 1.2 MB  00:00:00
Resolving Dependencies
--> Running transaction check
---> Package pmm2-client.x86_64 0:2.11.1-6.el7 will be installed
--> Finished Dependency Resolution

Dependencies Resolved

================================================================================================================================
 Package                     Arch                   Version                        Repository                              Size
================================================================================================================================
Installing:
 pmm2-client                 x86_64                 2.11.1-6.el7                   percona-release-x86_64                  42 M

Transaction Summary
================================================================================================================================
Install  1 Package

Total download size: 42 M
Installed size: 42 M
Downloading packages:
warning: /var/cache/yum/x86_64/7Server/percona-release-x86_64/packages/pmm2-client-2.11.1-6.el7.x86_64.rpm: Header V4 RSA/SHA256
 Signature, key ID 8507efa5: NOKEY
Public key for pmm2-client-2.11.1-6.el7.x86_64.rpm is not installed
pmm2-client-2.11.1-6.el7.x86_64.rpm                                                                      |  42 MB  00:00:07
Retrieving key from file:///etc/pki/rpm-gpg/PERCONA-PACKAGING-KEY
Importing GPG key 0x8507EFA5:
 Userid     : "Percona MySQL Development Team (Packaging key) "
 Fingerprint: 4d1b b29d 63d9 8e42 2b21 13b1 9334 a25f 8507 efa5
 Package    : percona-release-1.0-25.noarch (@/percona-release-latest.noarch)
 From       : /etc/pki/rpm-gpg/PERCONA-PACKAGING-KEY
Running transaction check
Running transaction test
Transaction test succeeded
Running transaction
  Installing : pmm2-client-2.11.1-6.el7.x86_64                                                                              1/1
  Verifying  : pmm2-client-2.11.1-6.el7.x86_64                                                                              1/1

Installed:
  pmm2-client.x86_64 0:2.11.1-6.el7

Complete!
That’s all for software installation. I just need to configure the agent to connect to the PMM Server:
[opc@al ~]$ sudo pmm-admin config --server-url https://admin:[email protected] --server-insecure-tls $(curl ident.me) generic OPC-$(hostname)


Checking local pmm-agent status...
pmm-agent is running.
Registering pmm-agent on PMM Server...
Registered.
Configuration file /usr/local/percona/pmm2/config/pmm-agent.yaml updated.
Reloading pmm-agent configuration...
Configuration reloaded.
Checking local pmm-agent status...
pmm-agent is running.
As you can see, I use the “ident-me” web service to identify my IP address, but you probably know your public IP.
This configuration goes to a file, which you should protect because it contains the password in clear text:
[opc@al ~]$ ls -l /usr/local/percona/pmm2/config/pmm-agent.yaml
-rw-r-----. 1 pmm-agent pmm-agent 805 Nov 28 20:22 /usr/local/percona/pmm2/config/pmm-agent.yaml
# Updated by `pmm-agent setup`.
---
id: /agent_id/853027e6-563e-42b8-a417-f144541358ff
listen-port: 7777
server:
  address: 18.194.119.174:443
  username: admin
  password: secretpassword
  insecure-tls: true
paths:
  exporters_base: /usr/local/percona/pmm2/exporters
  node_exporter: /usr/local/percona/pmm2/exporters/node_exporter
  mysqld_exporter: /usr/local/percona/pmm2/exporters/mysqld_exporter
  mongodb_exporter: /usr/local/percona/pmm2/exporters/mongodb_exporter
  postgres_exporter: /usr/local/percona/pmm2/exporters/postgres_exporter
  proxysql_exporter: /usr/local/percona/pmm2/exporters/proxysql_exporter
  rds_exporter: /usr/local/percona/pmm2/exporters/rds_exporter
  tempdir: /tmp
  pt_summary: /usr/local/percona/pmm2/tools/pt-summary
ports:
  min: 42000
  max: 51999
debug: false
trace: false
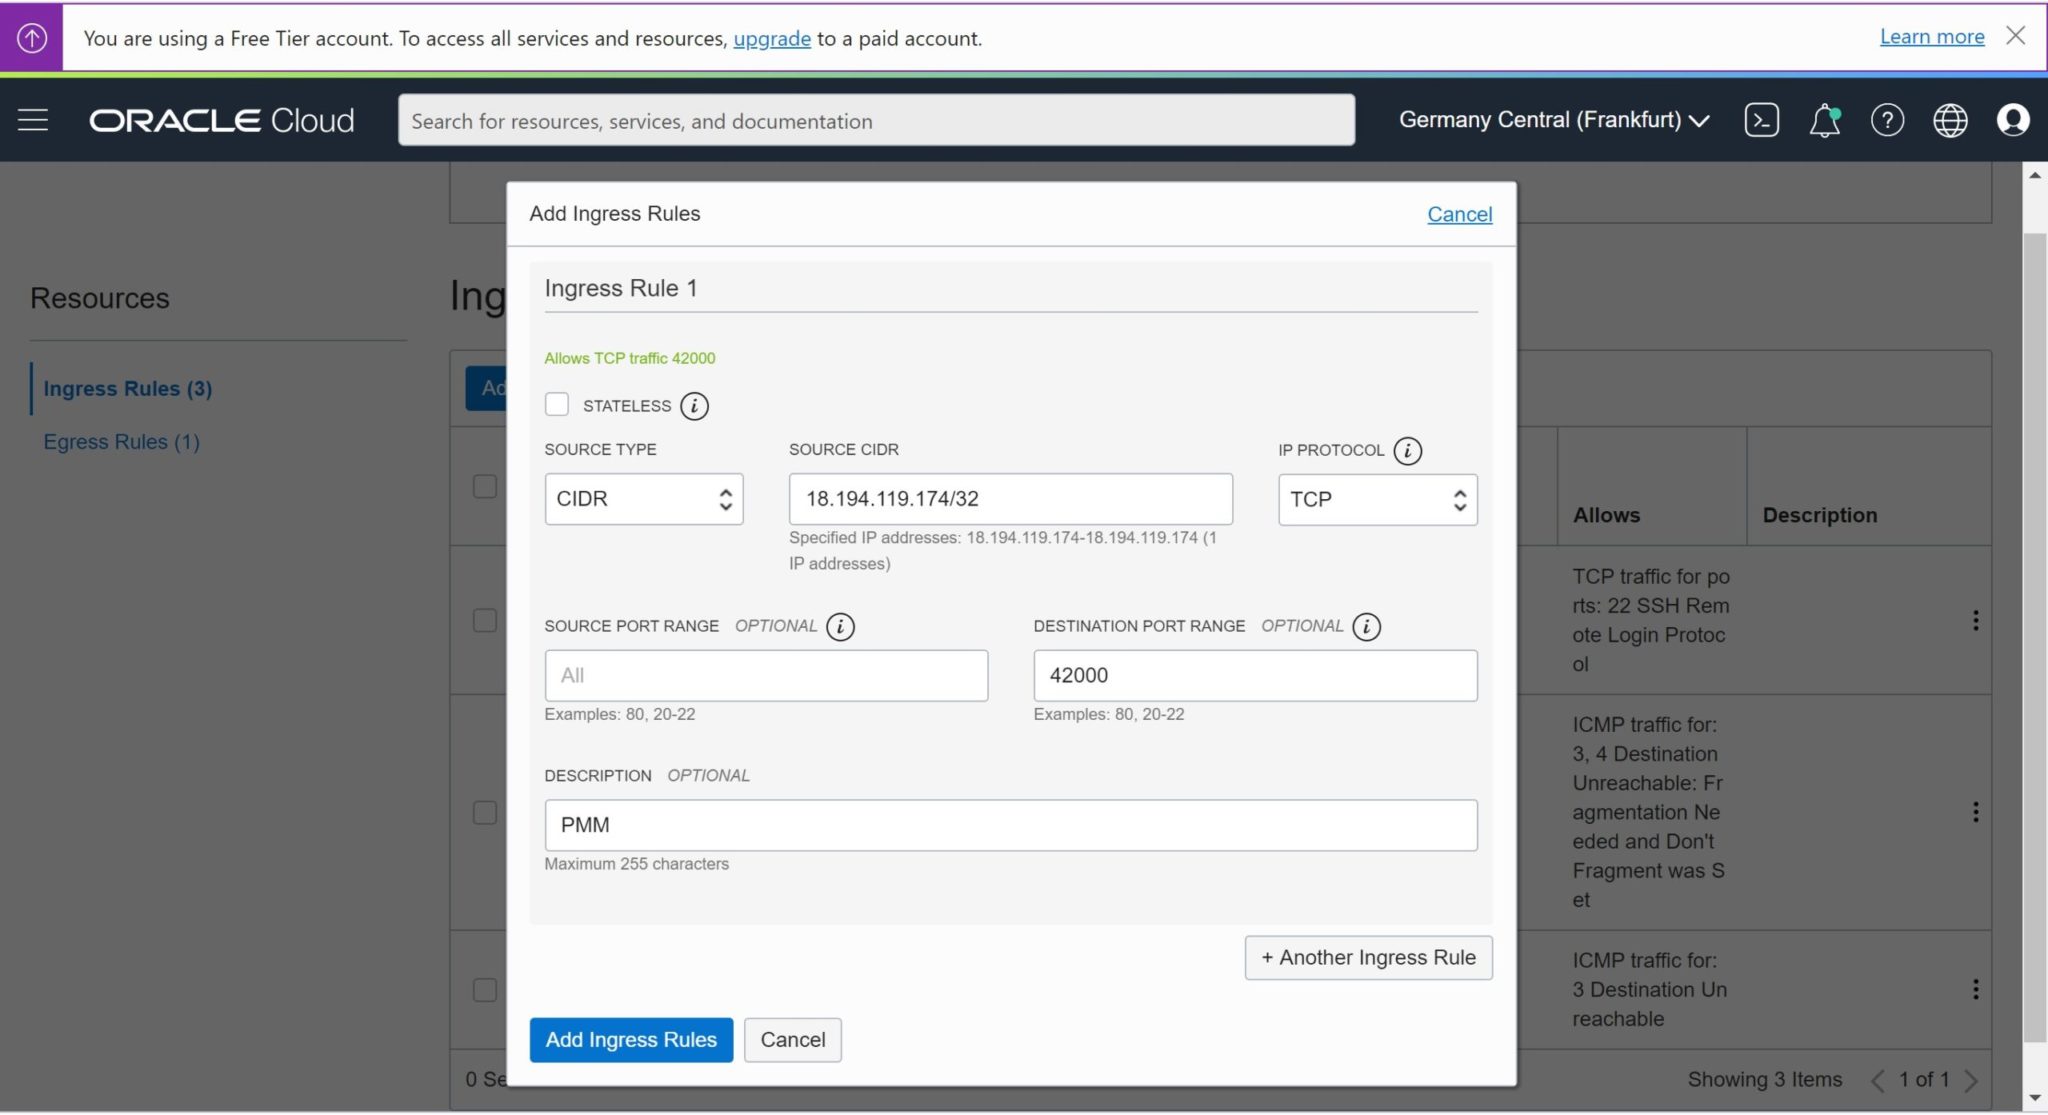
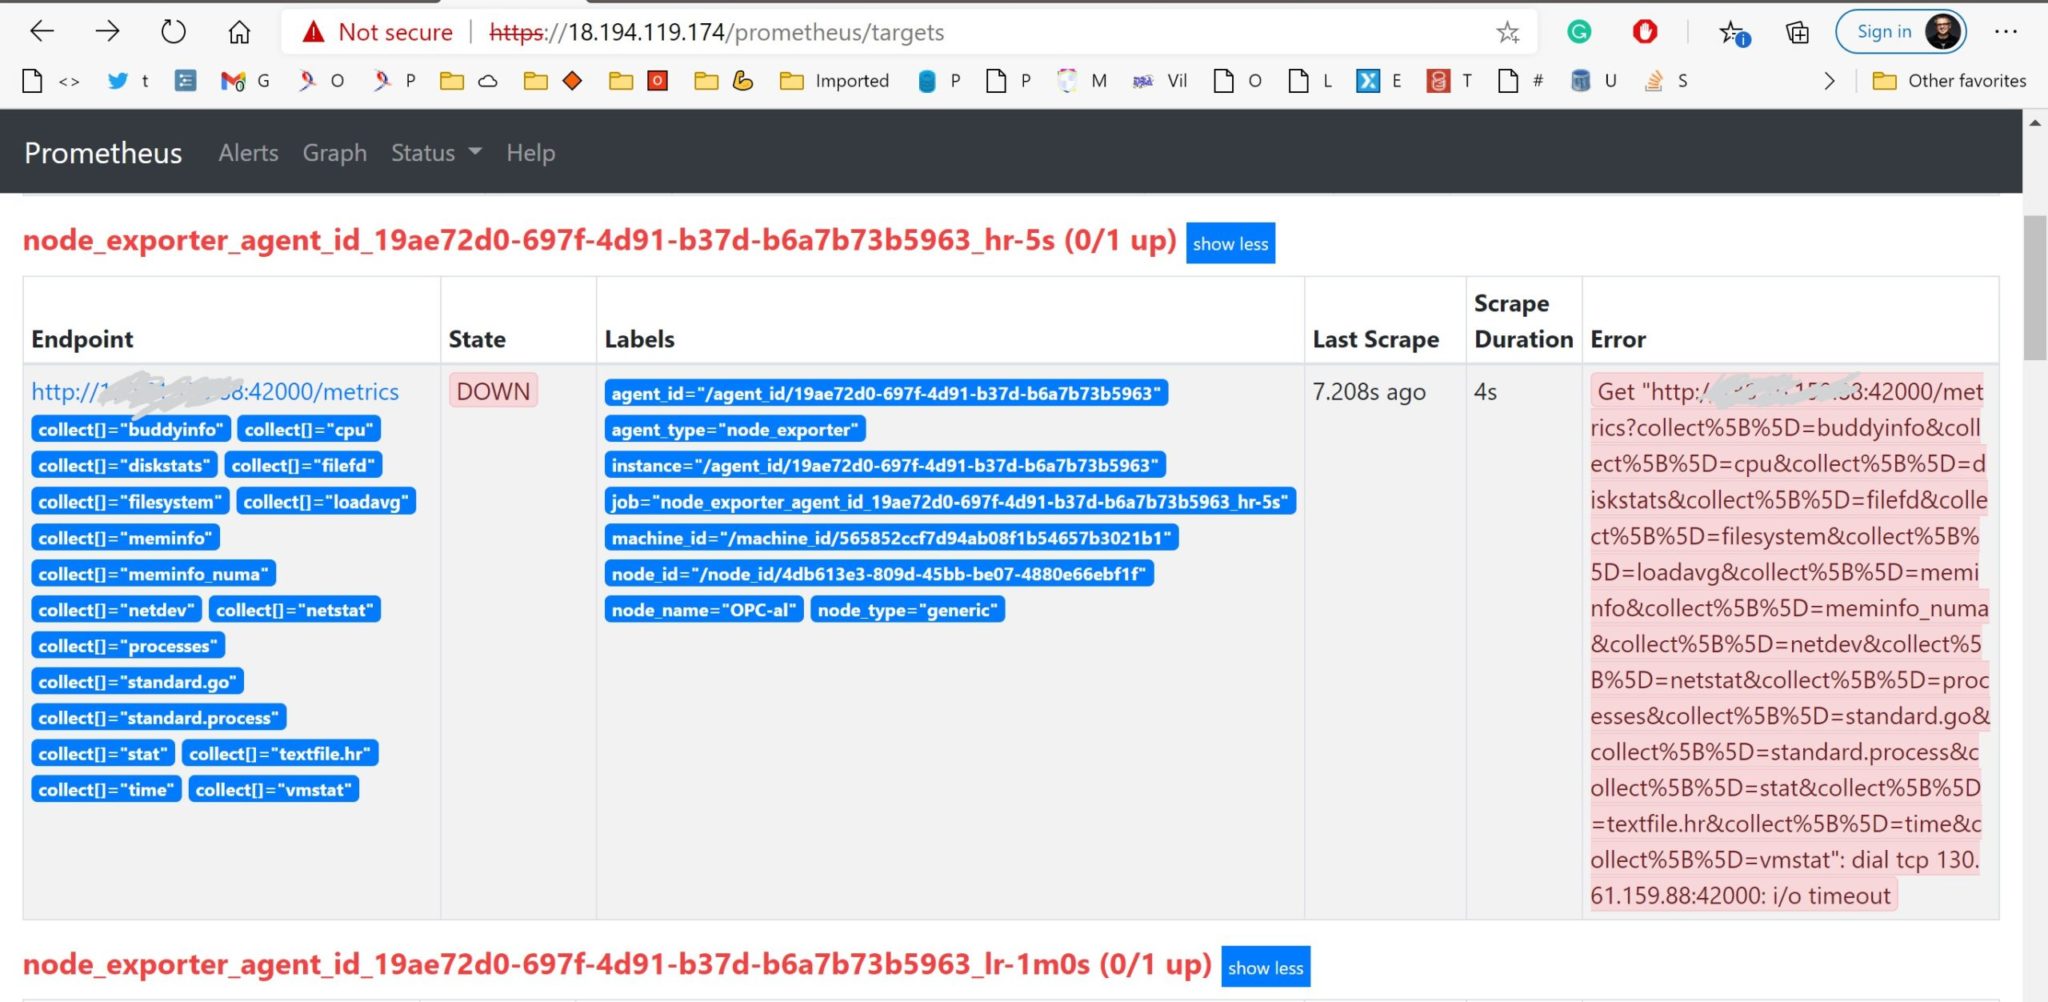
What is interesting here is the port that is used for the server to connect to pull metrics from the client: 42000
I’ll need to open this port. I can see the error from the PMM server: https://18.194.119.174/prometheus/targets
I open this port on the host:
[opc@al ~]$ sudo iptables -I INPUT 5 -i ens3 -p tcp --dport 42000 -m state --state NEW,ESTABLISHED -j ACCEPT
and on the ingress rules as well:
Testing
I’m running two processes here to test if I get the right metrics
[opc@al ~]$ while true ; do sudo dd bs=100M count=1                if=$(df -Th | sort -rhk3 | awk '/^[/]dev/{print $1;exit}') of=/dev/null ; done &
[opc@al ~]$ while true ; do sudo dd bs=100M count=10G iflag=direct if=$(df -Th | sort -rhk3 | awk '/^[/]dev/{print $1;exit}') of=/dev/null ; done &
The latter will do mostly I/O as I read with O_DIRECT and the former mainly system CPU as it reads from filesystem cache
Here is the Grafana dashboard from PMM:
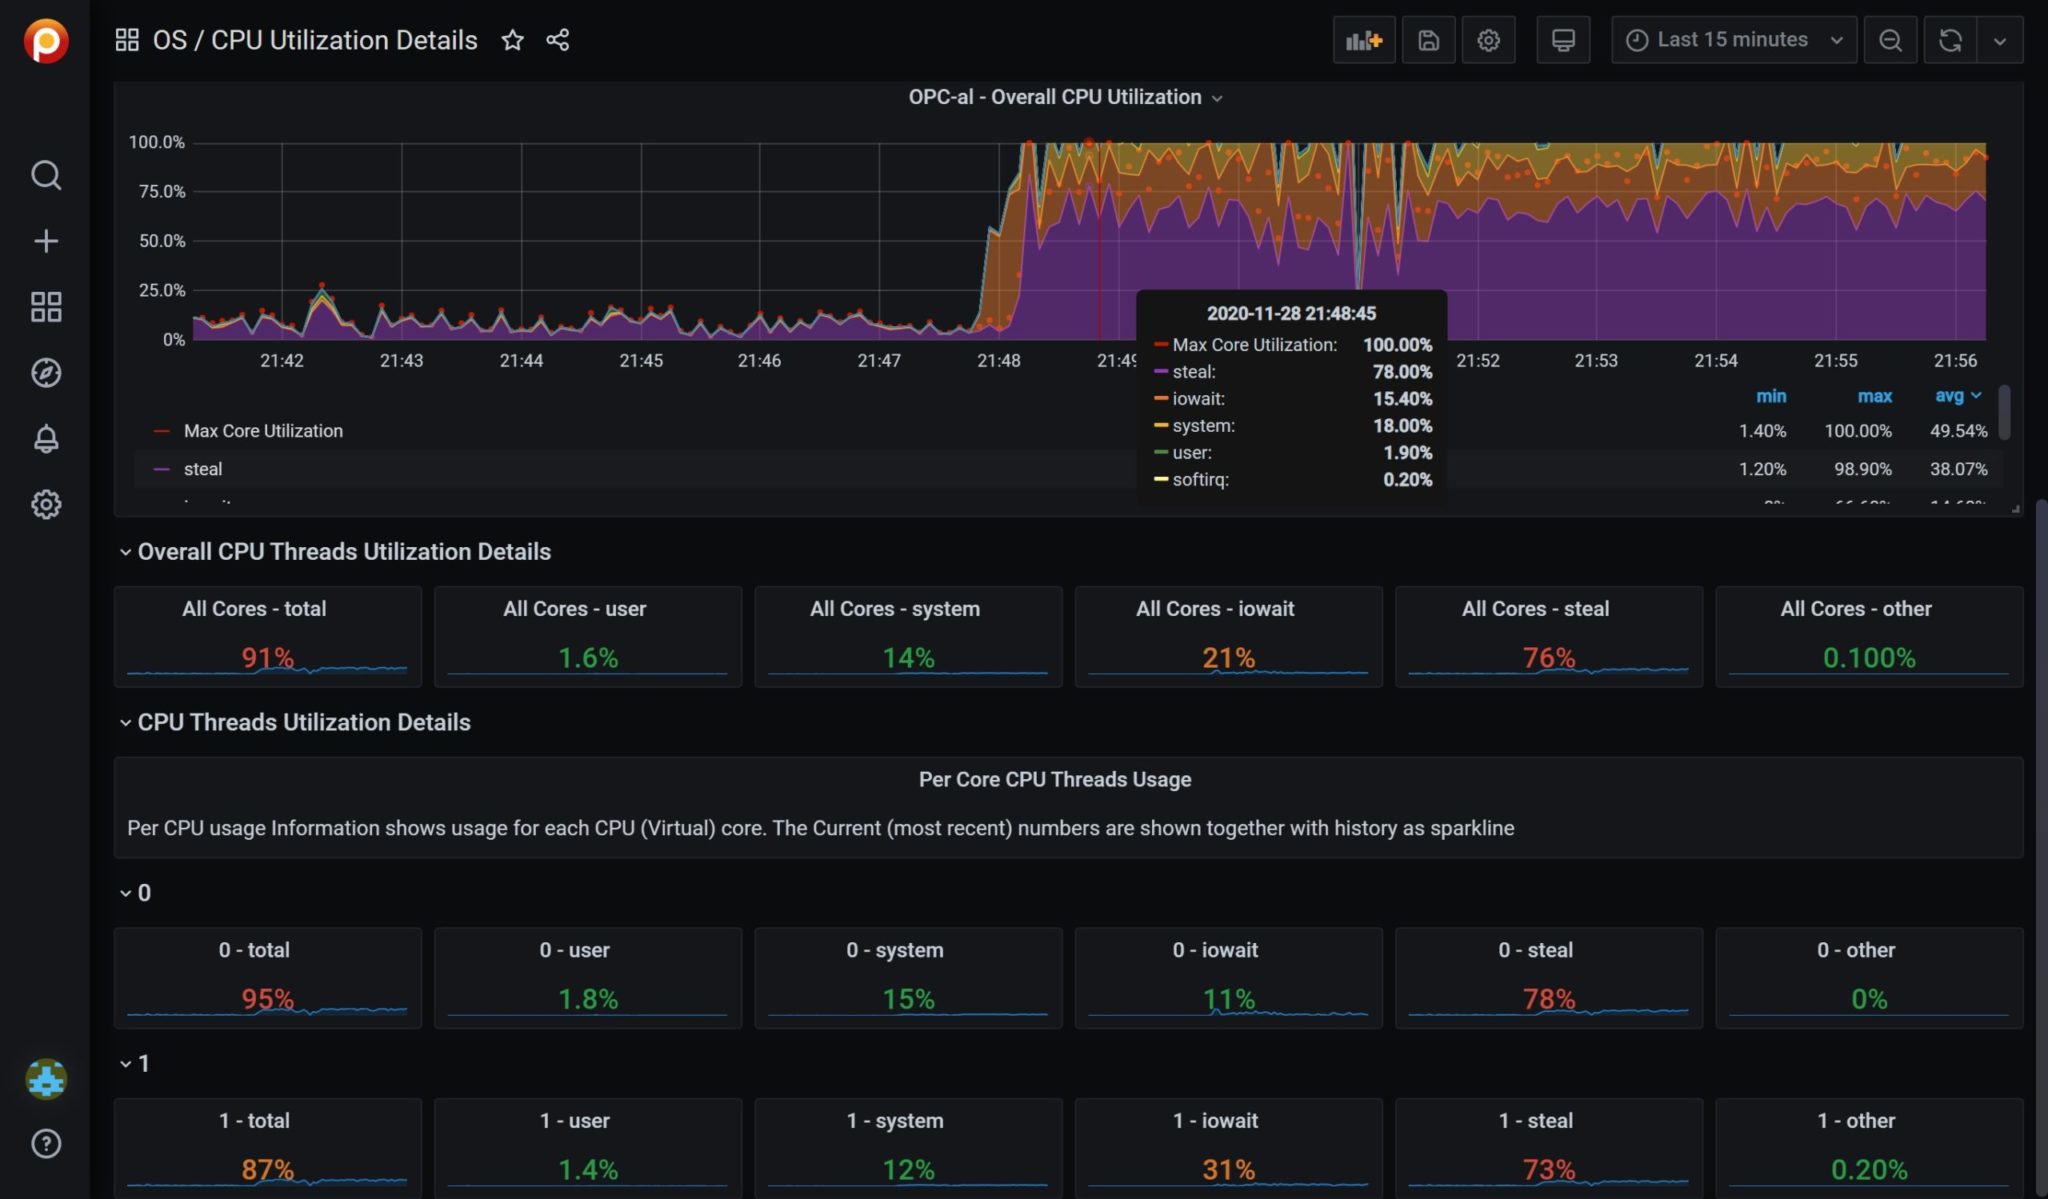
I see my two processes, and 80% of CPU stolen by the hypervisor as I’m running on the Free Tier here which provides 1/8th of OCPU.
If you have MySQL or PostgreSQL databases there, they can easily be monitored (“pmm-admin add MySQL” or “pmm-admin add MySQL” you can see all that in Elisa Usai demo: https://youtu.be/VgOR_GCUpVw?t=1558).
Last test, let’s see what happens if the monitored host reboots:
[opc@al ~]$ date
Sat Nov 28 22:54:36 CET 2020
[opc@al ~]$ uptrack-uname -a
Linux al 4.14.35-2025.402.2.1.el7uek.x86_64 #2 SMP Fri Oct 23 22:27:16 PDT 2020 x86_64 x86_64 x86_64 GNU/Linux
[opc@al ~]$ uname -a
Linux al 4.14.35-1902.301.1.el7uek.x86_64 #2 SMP Tue Mar 31 16:50:32 PDT 2020 x86_64 x86_64 x86_64 GNU/Linux
[opc@al ~]$ sudo systemctl reboot
Connection to 130.61.159.88 closed by remote host.
Connection to 130.61.159.88 closed.
Yes… I do not reboot it frequently because it is Autonomous Linux and the Effective kernel is up to date (latest patches from October) even if the last restart was in March. But this deserves a test.
The first interesting thing is that PMM seems to keep the last read metrics for a while:
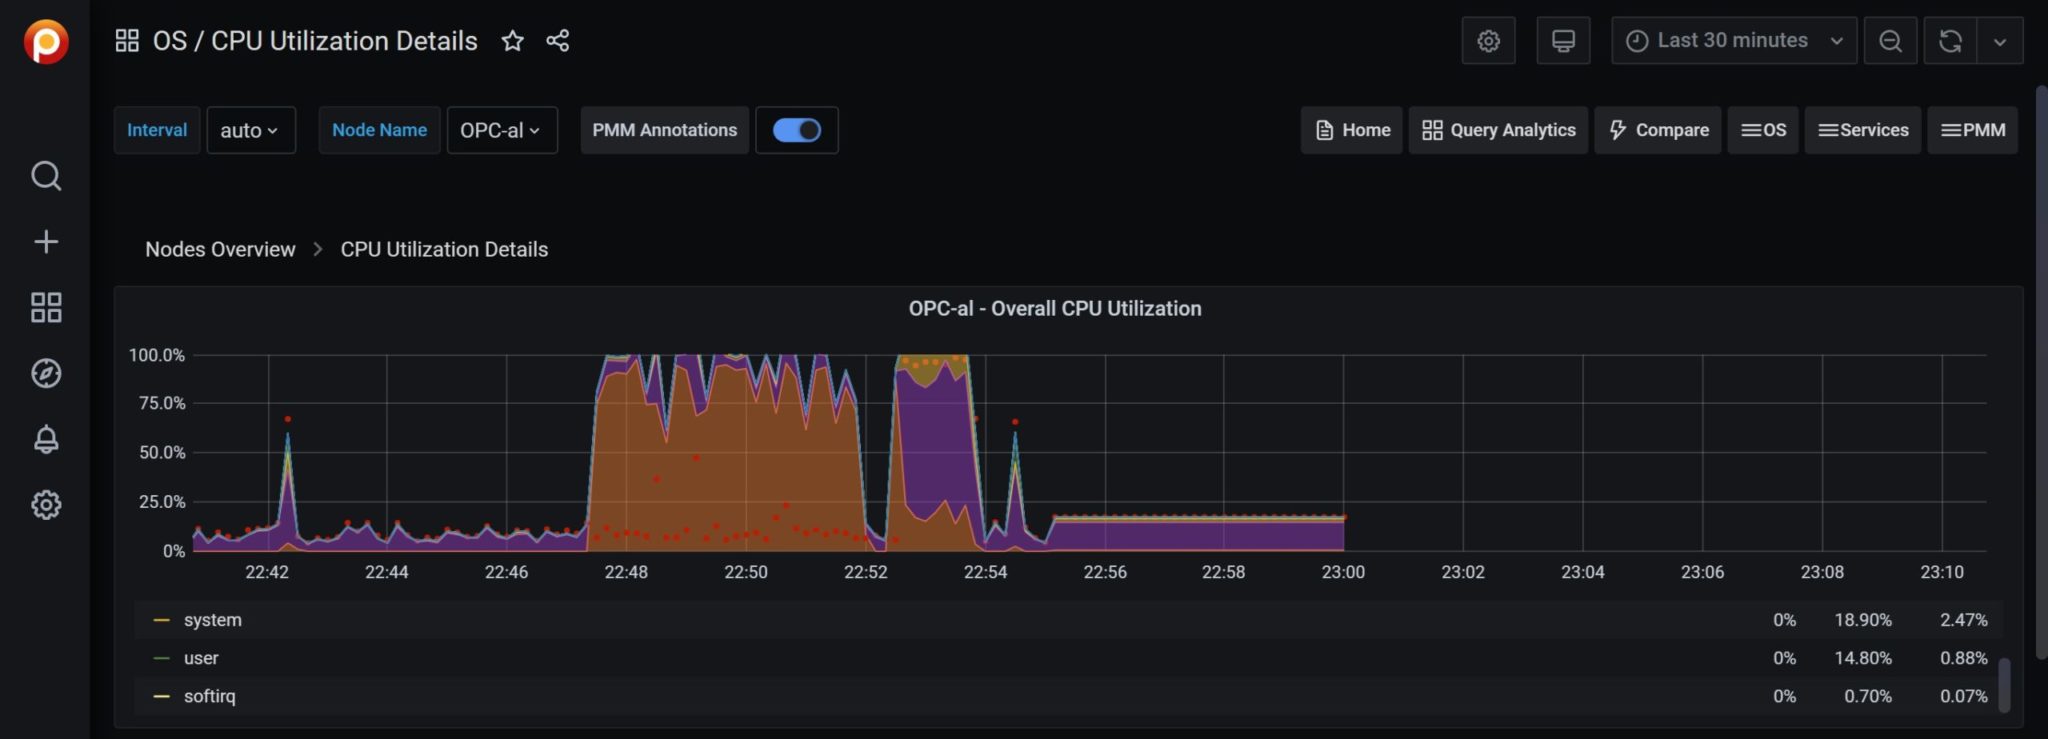
The host was shut down at 22:55 and it shows the last metrics for 5 minutes before stopping.
I had to wait for a while because my Availability Domain was out of capacity for the free tier:
Sometimes, even an Autonomous Linux must be rebooted. And if you are unlucky, there are no available servers in the Availability Domain and it remains stopped🤷♂️
(this is Free Tier) pic.twitter.com/sd3KIeoHkd— Franck Pachot (@FranckPachot) November 28, 2020
[opc@al ~]$ systemctl status pmm-agent.service
● pmm-agent.service - pmm-agent
   Loaded: loaded (/usr/lib/systemd/system/pmm-agent.service; enabled; vendor preset: disabled)
   Active: active (running) since Sat 2020-11-28 23:40:10 UTC; 1min 15s ago
 Main PID: 46446 (pmm-agent)
   CGroup: /system.slice/pmm-agent.service
           ├─46446 /usr/sbin/pmm-agent --config-file=/usr/local/percona/pmm2/config/pmm-agent.yaml
           └─46453 /usr/local/percona/pmm2/exporters/node_exporter --collector.bonding --collector.buddyinfo --collector.cpu ...
No problem, the installation of PMM client has defined the agent to restart on reboot.
In summary, PMM pulls the metric from the exporter, so you need to open inbound ports on the host where the PMM client agent runs. And HTTPS on the PMM server. Then everything is straightforward.
![Thumbnail [60x60]](https://www.dbi-services.com/blog/wp-content/uploads/2022/05/pngtree-cloud-logo-design-template-vector-isolated-png-image_783722-wpcf_100x100.jpg)
![Thumbnail [90x90]](https://www.dbi-services.com/blog/wp-content/uploads/2022/08/DWE_web-min-scaled.jpg)