This post is the second part of https://www.dbi-services.com/blog/aws-aurora-xactsync-batch-commit/ where I’ve run row-by-row inserts on AWS Aurora with different size of intermediate commit. Without surprise the commit-each-row anti-pattern has a negative effect on performance. And I mentioned that this is even worse in Aurora where the session process sends directly the WAL to the network storage and waits, at commit, that it is acknowledged by at least 4 out of the 6 replicas. An Aurora specific wait event is sampled on these waits: XactSync. At the end of the post I have added some CloudWatch statistics about the same running in RDS but with the EBS-based PostgreSQL rather than the Aurora engine. The storage is then an EBS volume mounted on the EC2 instance. Here is the result, in this post, with a Single AZ storage, and a second run where the volume is synchronized in Multi-AZ.
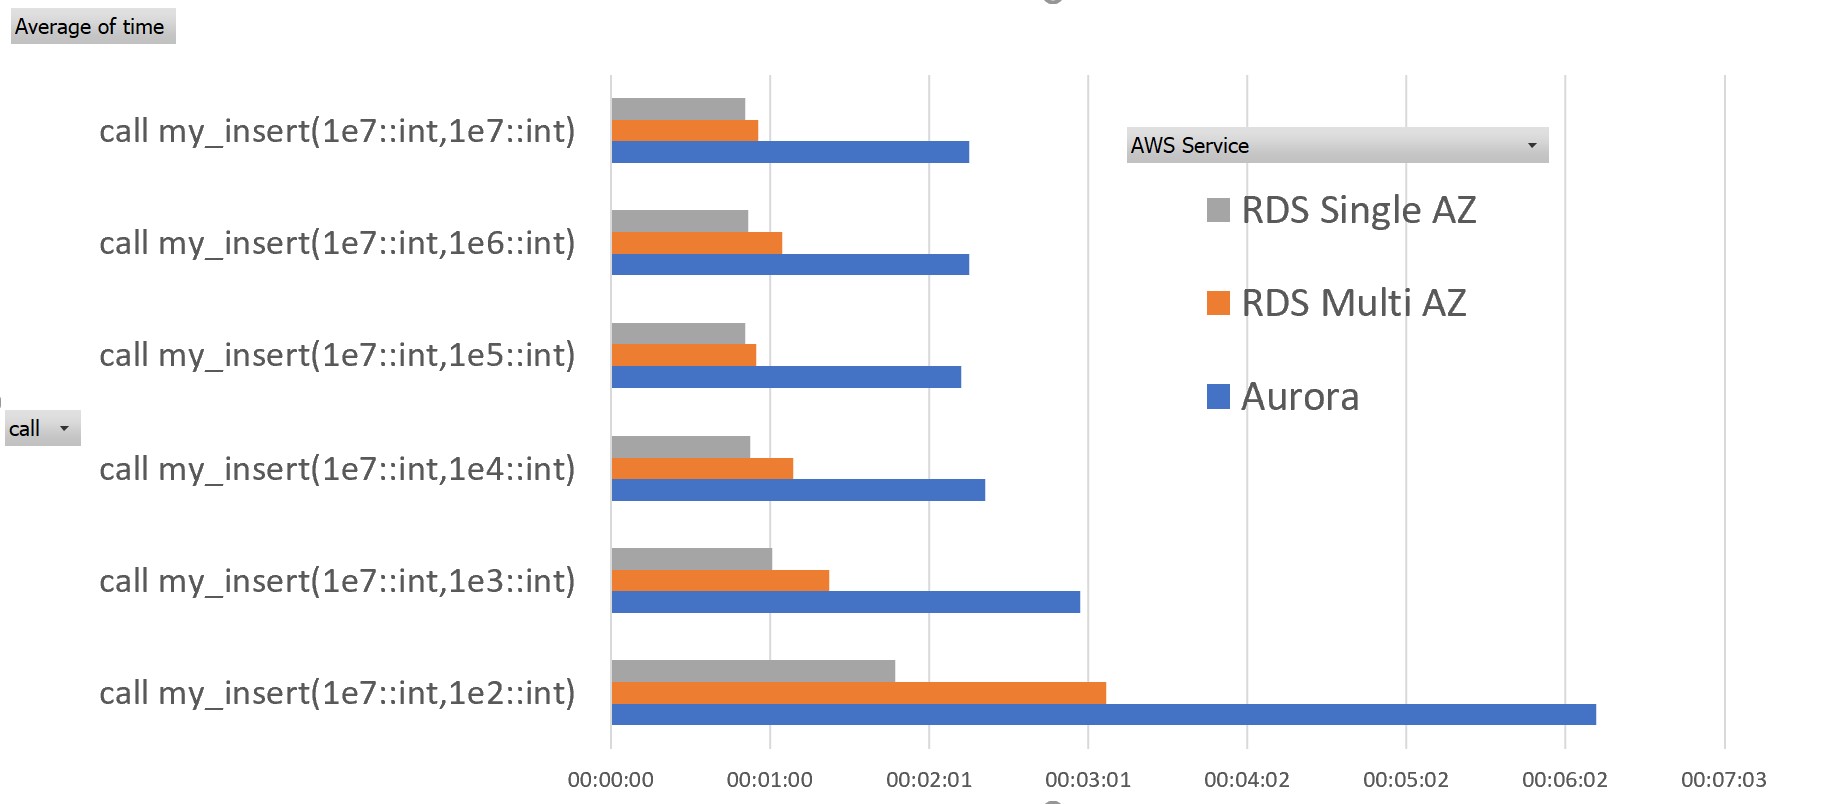
TL;DR: I have put all that in a small graph showing the elapsed time for all runs from the previous and current post. Please keep in mind that this is not a benchmark. Just one test with one specific workload. I’ve put everything to reproduce it below. Remember that the procedure my_insert(1e7,1e2) inserts 10 million rows with a commit every 100 rows.
Before explaining in the results here the detail. I put it quickly as it is the same as in the last post: the Aurora PostgreSQL engine has the same SQL API so I changed only the endpoint in the $db environment variable.
RDS PostgreSQL
I have created a database on RDS with the real PostgreSQL the same as I did in the previous post on Aurora:

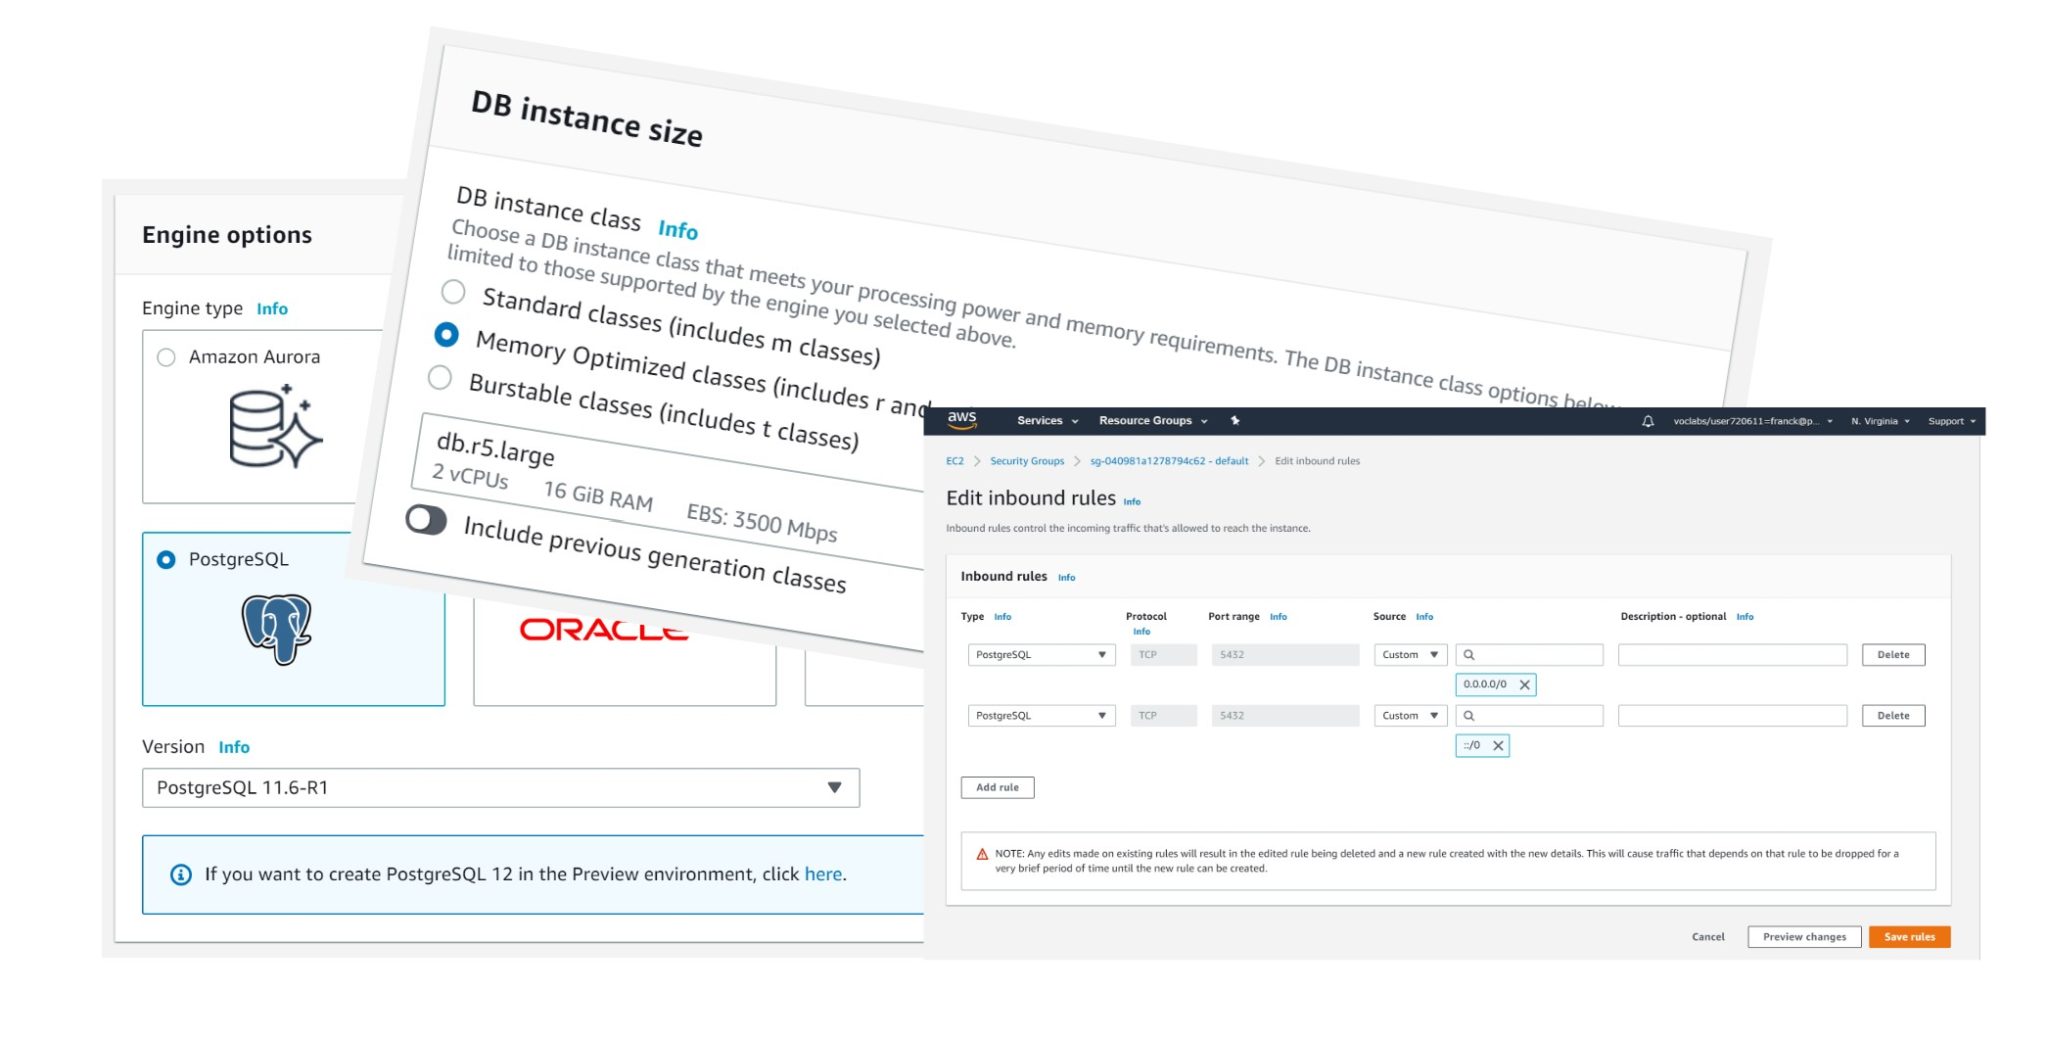
In order to run on the same EC2 shape, I selected the “Memory Optimized classes” db.r5large and in this test I disabled Multi-AZ.
Here is the single run in one transaction:
[opc@b aws]$ PGPASSWORD=FranckPachot psql -p 5432 -h $db -U postgres demo -e < /tmp/run.sql
truncate table demo;
TRUNCATE TABLE
vacuum demo;
VACUUM
Expanded display is on.
select * from pg_stat_database where datname='demo'
Timing is on.
call my_insert(1e7::int,10000000);
CALL
Time: 55908.947 ms (00:55.909)
Timing is off.
select tup_inserted-1000070"+ tup_inserted",xact_commit-1063"+ xact_commit" from pg_stat_database where datname='demo';
-[ RECORD 1 ]--+---------
+ tup_inserted | 10000000
+ xact_commit  | 14
Here with my quick active session history sample:
[opc@b aws]$ while true ; do echo "select pg_sleep(0.1);select state,to_char(clock_timestamp(),'hh24:mi:ss'),coalesce(wait_event_type,'-null-'),wait_event,query from pg_stat_activity where application_name='psql' and pid != pg_backend_pid();" ; done | PGPASSWORD=FranckPachot psql -p 5432 -h $db -U postgres demo | awk -F "|" '/^ *active/{$2="";c[$0]=c[$0]+1}END{for (i in c){printf "%8d %s\n", c[i],i}}' | sort -n & PGPASSWORD=FranckPachot psql -p 5432 -h $db -U postgres demo -e < /tmp/run.sql ; pkill psql
[1] 29583
truncate table demo;
TRUNCATE TABLE
vacuum demo;
VACUUM
Expanded display is on.
select * from pg_stat_database where datname='demo'
Timing is on.
call my_insert(1e7::int,10000000);
CALL
Time: 56175.302 ms (00:56.175)
Timing is off.
select tup_inserted-11000070"+ tup_inserted",xact_commit-1102"+ xact_commit" from pg_stat_database where datname='demo';
-[ RECORD 1 ]--+---------
+ tup_inserted | 10000000
+ xact_commit  | 346

       3  active    IO         DataFileExtend   call my_insert(1e7::int,10000000);
     160  active    -null-                  call my_insert(1e7::int,10000000);
[opc@b aws]$
No samples for waiting except the table file extension.
Now running the loop with decreasing commit size:
call my_insert(1e7::int,1e7::int);
CALL
Time: 50659.978 ms (00:50.660)

       2  active    IO         DataFileExtend   call my_insert(1e7::int,1e7::int);
     139  active    -null-                  call my_insert(1e7::int,1e7::int);

call my_insert(1e7::int,1e6::int);
CALL
Time: 51760.251 ms (00:51.760)

       2  active    IO         DataFileExtend   call my_insert(1e7::int,1e6::int);
     154  active    -null-                  call my_insert(1e7::int,1e6::int);

call my_insert(1e7::int,1e5::int);
CALL
Time: 50694.917 ms (00:50.695)

       3  active    IO         DataFileExtend   call my_insert(1e7::int,1e5::int);
     139  active    -null-                  call my_insert(1e7::int,1e5::int);

call my_insert(1e7::int,1e4::int);
CALL
Time: 52569.108 ms (00:52.569)

       1  active    IO         WALWrite     call my_insert(1e7::int,1e4::int);
       3  active    IO         DataFileExtend   call my_insert(1e7::int,1e4::int);
     151  active    -null-                  call my_insert(1e7::int,1e4::int);

call my_insert(1e7::int,1e3::int);
CALL
Time: 60799.896 ms (01:00.800)

       4  active    IO         DataFileExtend   call my_insert(1e7::int,1e3::int);
       5  active    IO         WALWrite     call my_insert(1e7::int,1e3::int);
     186  active    -null-                  call my_insert(1e7::int,1e3::int);

call my_insert(1e7::int,1e2::int);
CALL
Time: 108391.218 ms (01:48.391)

       1  active    IO         WALWrite     call my_insert(1e7::int,1e2::int);
       1  active    LWLock     WALWriteLock   call my_insert(1e7::int,1e2::int);
       1  active    -null-                  vacuum demo;
       2  active    IO         DataFileExtend   call my_insert(1e7::int,1e2::int);
     315  active    -null-                  call my_insert(1e7::int,1e2::int);
When the commit frequency increase we start to see WALWrite samples, but still not a lot. Please, remember that this is sampling. WALWrite occurs often especially with frequent commits but the low latency storage (SSD with 1000 Provisioned IOPS here) makes it infrequently sampled.
The CloudWatch statistics are in the previous post so that it is easier to compare.
Multi AZ
I’ve created the same except that I’ve enabled “Multi-AZ deployment” where the storage is synchronously replicated into another data centre. This adds a lot for reliability: failover within a few minutes with no data loss. And a bit of performance as the backups can be offloaded on the replica. But of course, being synchronous, it increases the write latency. Here is the result with the same run with multiple commit size:
call my_insert(1e7::int,1e7::int);
CALL
Time: 55902.530 ms (00:55.903)

       1  active    -null-                  select * from pg_stat_database where datname='demo'
       3  active    IO         DataFileExtend   call my_insert(1e7::int,1e7::int);
     158  active    -null-                  call my_insert(1e7::int,1e7::int);

call my_insert(1e7::int,1e6::int);
CALL
Time: 64711.467 ms (01:04.711)

       3  active    Lock       relation     truncate table demo;
       6  active    IO         DataFileExtend   call my_insert(1e7::int,1e6::int);
     176  active    -null-                  call my_insert(1e7::int,1e6::int);

call my_insert(1e7::int,1e5::int);
CALL
Time: 55480.628 ms (00:55.481)

       1  active    IO         WALWrite     call my_insert(1e7::int,1e5::int);
       5  active    IO         DataFileExtend   call my_insert(1e7::int,1e5::int);
     155  active    -null-                  call my_insert(1e7::int,1e5::int);

call my_insert(1e7::int,1e4::int);
CALL
Time: 69491.522 ms (01:09.492)

       1  active    IO         DataFileImmediateSync   truncate table demo;
       1  active    IO         WALWrite     call my_insert(1e7::int,1e4::int);
       6  active    IO         DataFileExtend   call my_insert(1e7::int,1e4::int);
     192  active    -null-                  call my_insert(1e7::int,1e4::int);

call my_insert(1e7::int,1e3::int);
CALL
Time: 82964.170 ms (01:22.964)

       2  active    IO         DataFileExtend   call my_insert(1e7::int,1e3::int);
       2  active    IO         WALWrite     call my_insert(1e7::int,1e3::int);
     233  active    -null-                  call my_insert(1e7::int,1e3::int);

call my_insert(1e7::int,1e2::int);
CALL
Time: 188313.372 ms (03:08.313)

       1  active    -null-                  truncate table demo;
       2  active    IO         WALWrite     call my_insert(1e7::int,1e2::int);
       6  active    IO         DataFileExtend   call my_insert(1e7::int,1e2::int);
     562  active    -null-                  call my_insert(1e7::int,1e2::int);
The overhead in performance is really small, so this Multi-AZ is a good recommendation for production if cost allows it.
Reliability vs. Performance
Without a surprise, writing the redo log to remote storage increases the latency. We see a small difference between Single and Multi-AZ. And we see a big difference with Aurora which replicates to three AZs. There are 5 pillars in the AWS Well-Architected Framework: Operational Excellence, Security, Reliability, Performance Efficiency and Cost Optimization. I like the 5 axis, but calling them “pillars” supposes that they have all the same height and weight, which is not the case. When you go Multi-AZ you increase the reliability, but the cost as well. When going to Aurora you push the reliability even further but the performance decreases as well for writes. This is no surprise: Aurora is single-master. You can scale reads to multiple replicas but the write endpoint goes to one single instance.
And finally a larger conclusion. You can get better agility with microservices (Aurora is one database platform service built on multiple infrastructure services: compute, buffer cache, storage). You can get better scalability with replicas. And reliability with synchronization. And better performance with high-performance disks and low-latency network. But in 2020 as well as 40 years ago your best investment is in application design. In this example, once you avoid row-by-row commit and be ready to bulk commit, you are free to choose any option for your availability and cost requirements. If you don’t opt for a scalable code design, just re-using a crude row-by-row API, you will have mediocre performance which will constrain your availability and scalability options.

![Thumbnail [60x60]](https://www.dbi-services.com/blog/wp-content/uploads/2022/05/open-source-author.png)
![Thumbnail [90x90]](https://www.dbi-services.com/blog/wp-content/uploads/2025/03/OBA_web-scaled.jpg)
![Thumbnail [90x90]](https://www.dbi-services.com/blog/wp-content/uploads/2022/08/FRJ_web-min-scaled.jpg)