Azure Database watcher is a managed monitoring service designed to provide insights and diagnostics for Azure databases and Azure Managed Instance. It helps database administrators and developers track performance, detect anomalies and troubleshoot issues efficiently. By collecting telemetry data, logs and metrics, Azure Database watcher enables proactive monitoring and alerting, ensuring database health and optimal performance. Moreover, Database watcher is currently in preview.
Service components
- Database watcher
- The component responsible for collecting data using (for example) DMVs
- Targets
- The components to monitor (supported components) :
- Azure SQL Database
- Elastic pool
- Azure SQL Managed Instance
- Azure SQL Database
- The components to monitor (supported components) :
- Data store
- The component that will store our data :
- Azure Data Explorer
- Real-Time Analytics in Microsoft Fabric
- The component that will store our data :
What does it look like in our demo ?
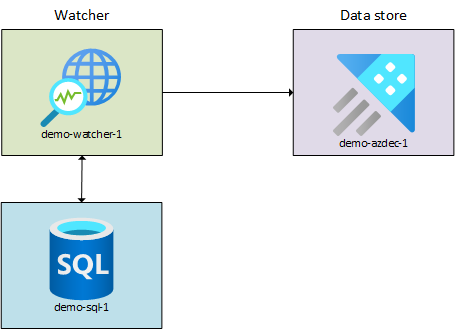
Deployment
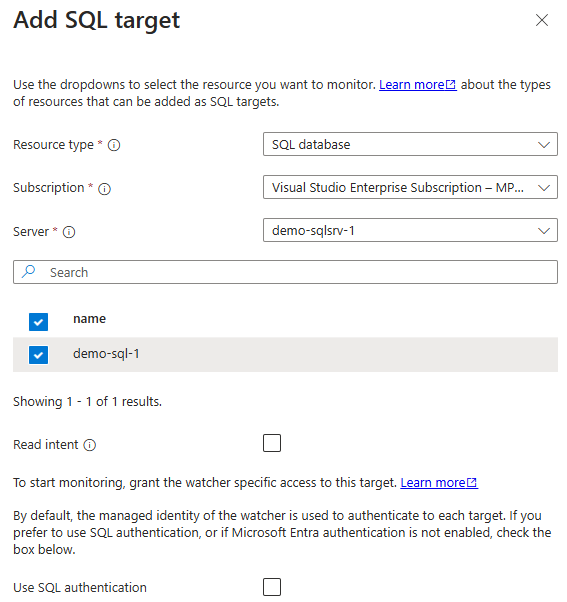
We have an Azure SQL Database component at our disposal, which hosts a database called demo-sql-1. This database, along with our SQL server demo-sqlsrv-1, will be monitored.
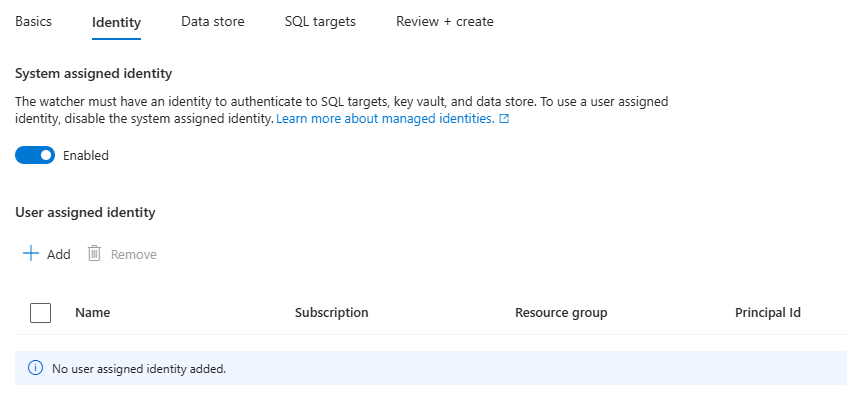
The Database Watcher component connects to our instance using a system-assigned identity to collect the necessary information.
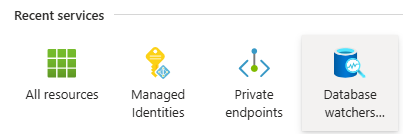
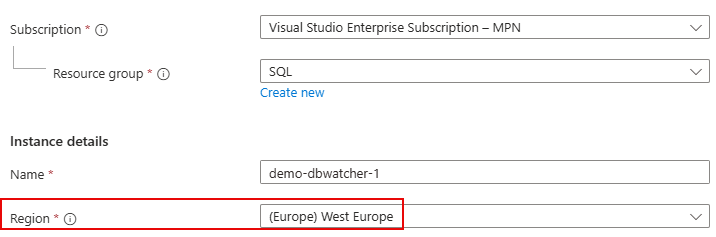
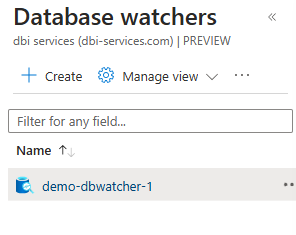
Database watcher creation :
The service is not yet available in the “Switzerland North” region.
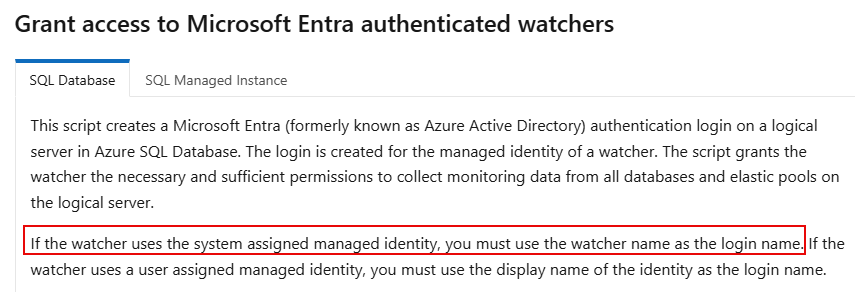
The name of the system-assigned service principal is always the same as the name of the Azure resource it’s created for. In our case, we will need to grant some specfic privileges on the SQL database to the service principal (identified as demo-watcher-1).
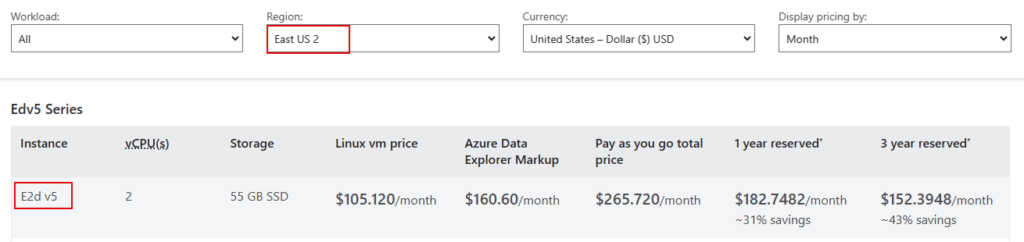
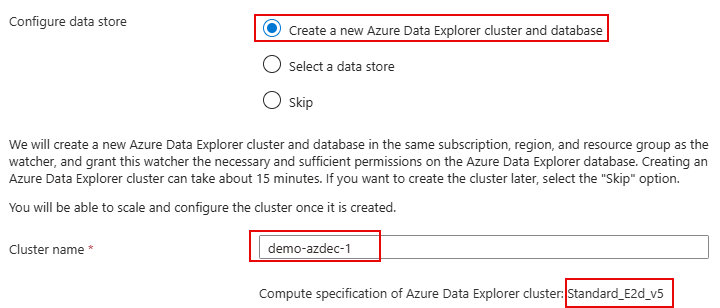
If the Azure Data Explorer resource is not created beforehand, one is suggested (E2d v5) :
Azure Data Explorer cluster and database :
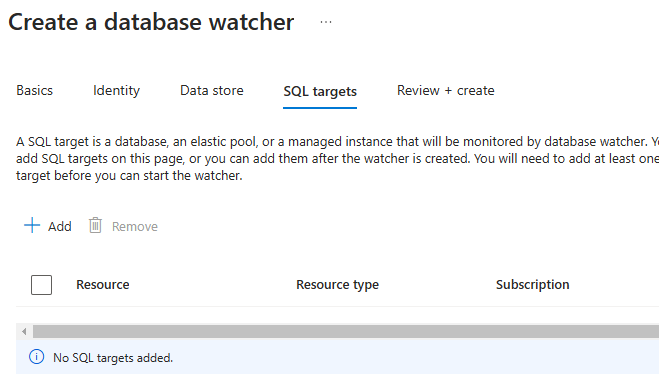
Add targets :
The resource is deployed :
Currently, the service is not accessible because it’s not started and we did not grant the necessary privileges.
We are going to grant the related privileges :
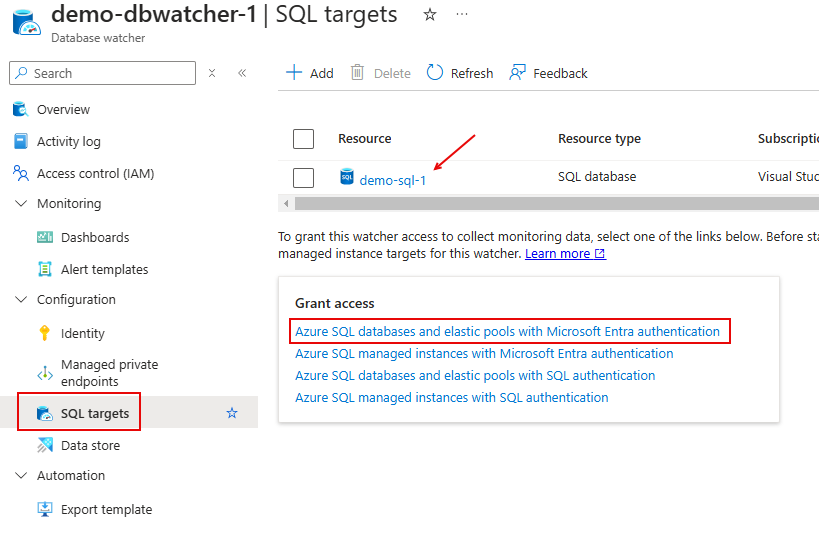
Privileges to grant in the case of an Azure SQL Database component :
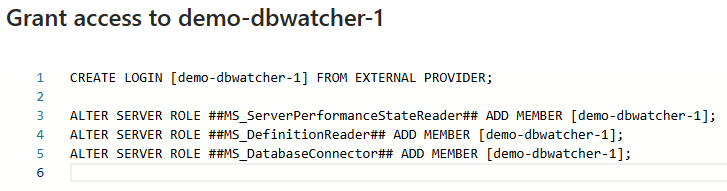
CREATE LOGIN [demo-dbwatcher-1] FROM EXTERNAL PROVIDER;

ALTER SERVER ROLE ##MS_ServerPerformanceStateReader## ADD MEMBER [demo-dbwatcher-1];
ALTER SERVER ROLE ##MS_DefinitionReader## ADD MEMBER [demo-dbwatcher-1];
ALTER SERVER ROLE ##MS_DatabaseConnector## ADD MEMBER [demo-dbwatcher-1];
The created login on SQL side :

As specified earlier the name of the system-assigned service principal is always the same as the name of the Azure resource it’s created for :
https://learn.microsoft.com/en-us/azure/azure-sql/database-watcher-manage?view=azuresql&tabs=sqldb
Permission issues ?
It is possible that after starting the Azure Database watcher component, it appears blank. In this case, you may encounter a permission issue with the Azure Data Explorer component (in our case).
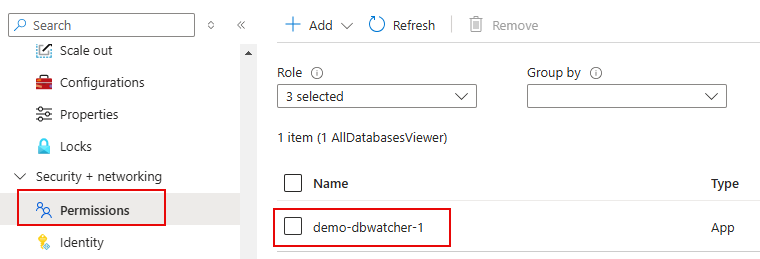
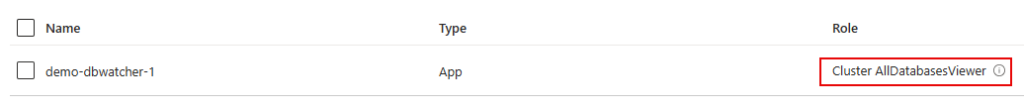
We assign the right permissions on the Azure Data Explorer component :
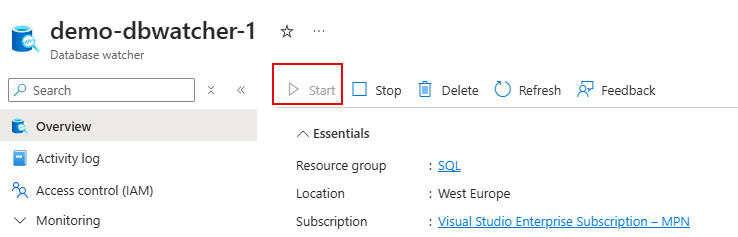
Once is done you will need to start the service :
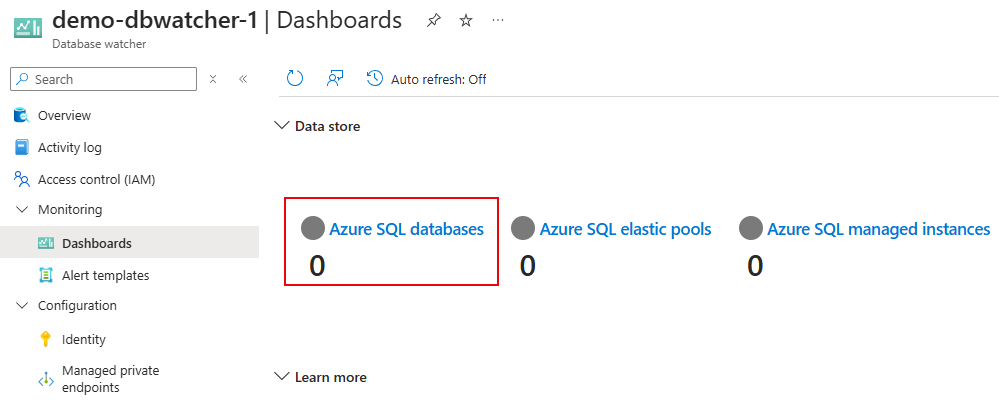
We select the Dashboards link :
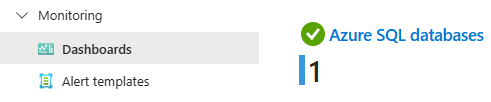
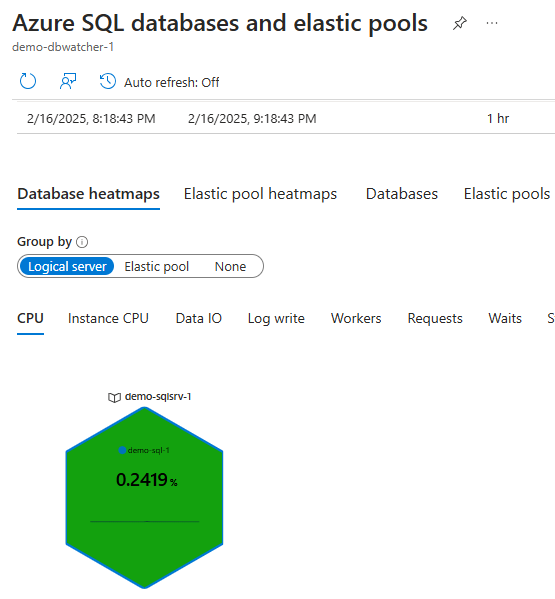
Our database is being monitored. Initially, we access the heatmap :
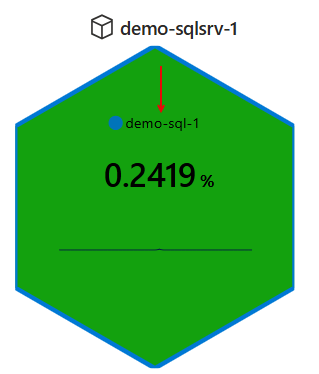
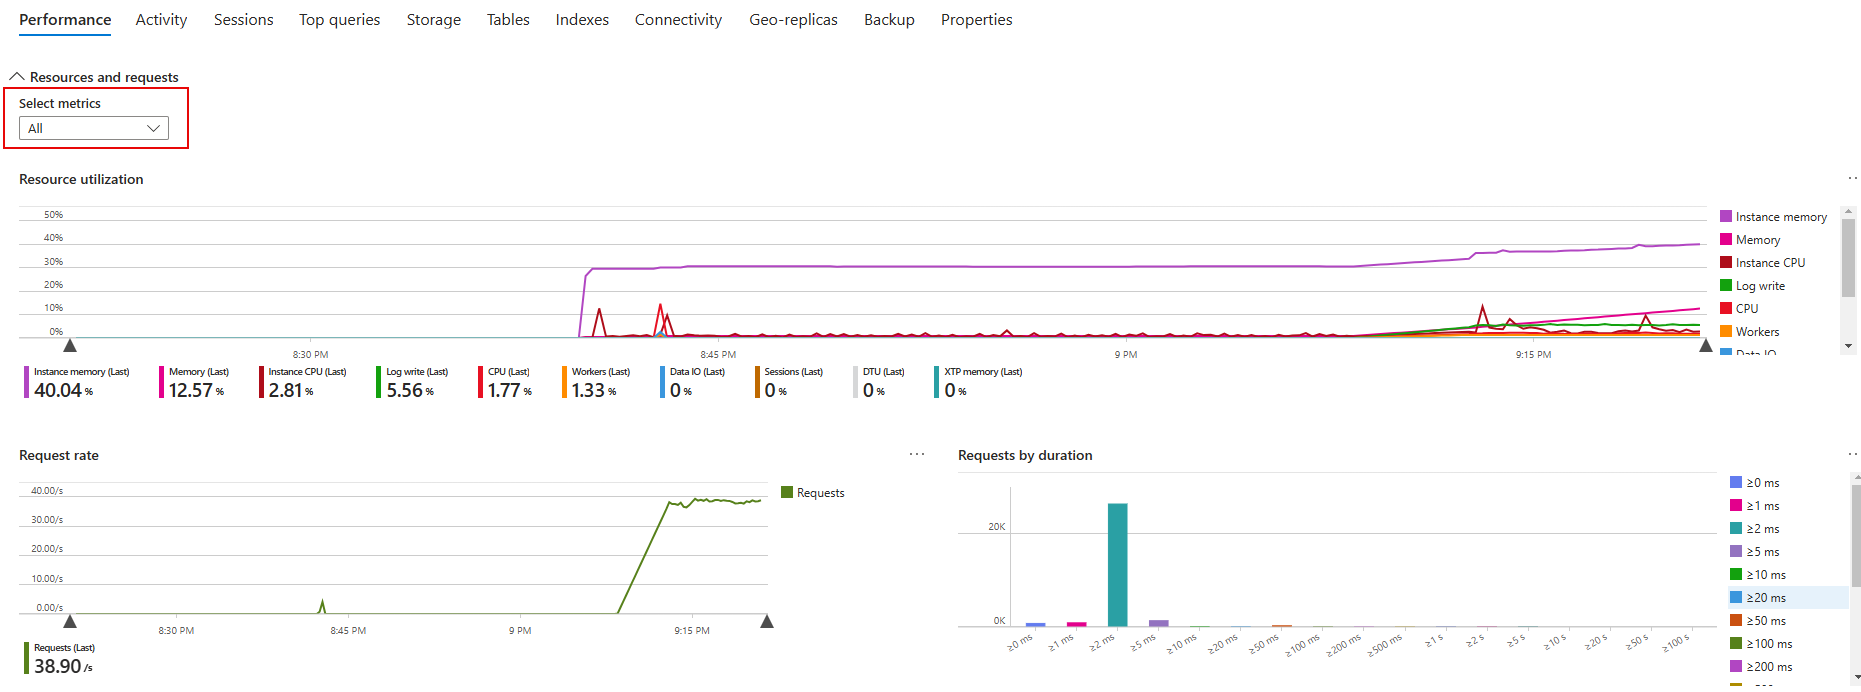
However, by clicking on the database name “demo-sql-1”, we gain access to more information:
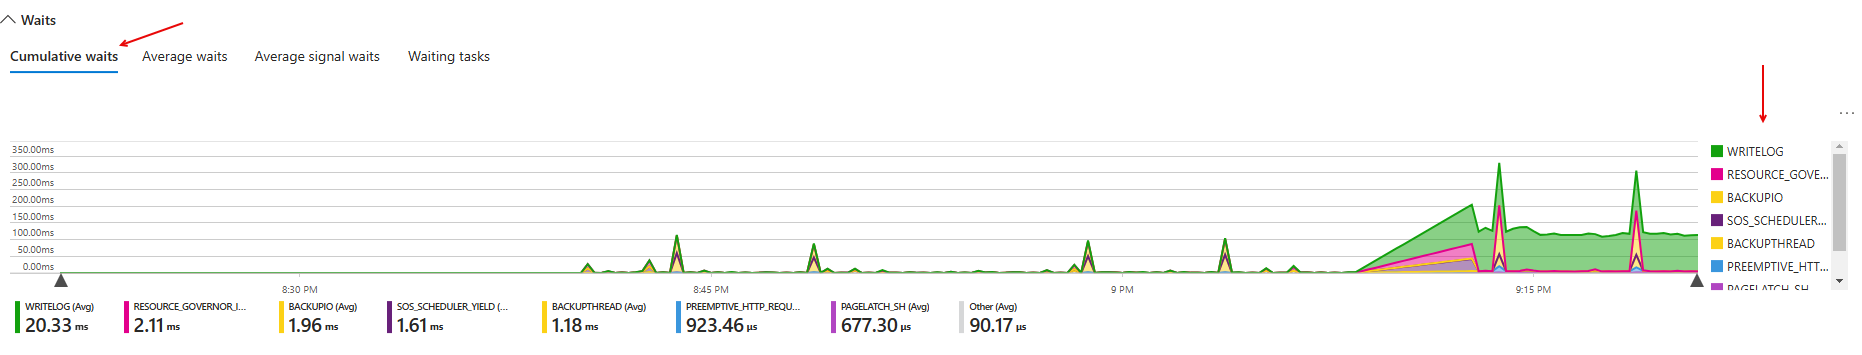
We also have easy access to waits. They are categorized by type :
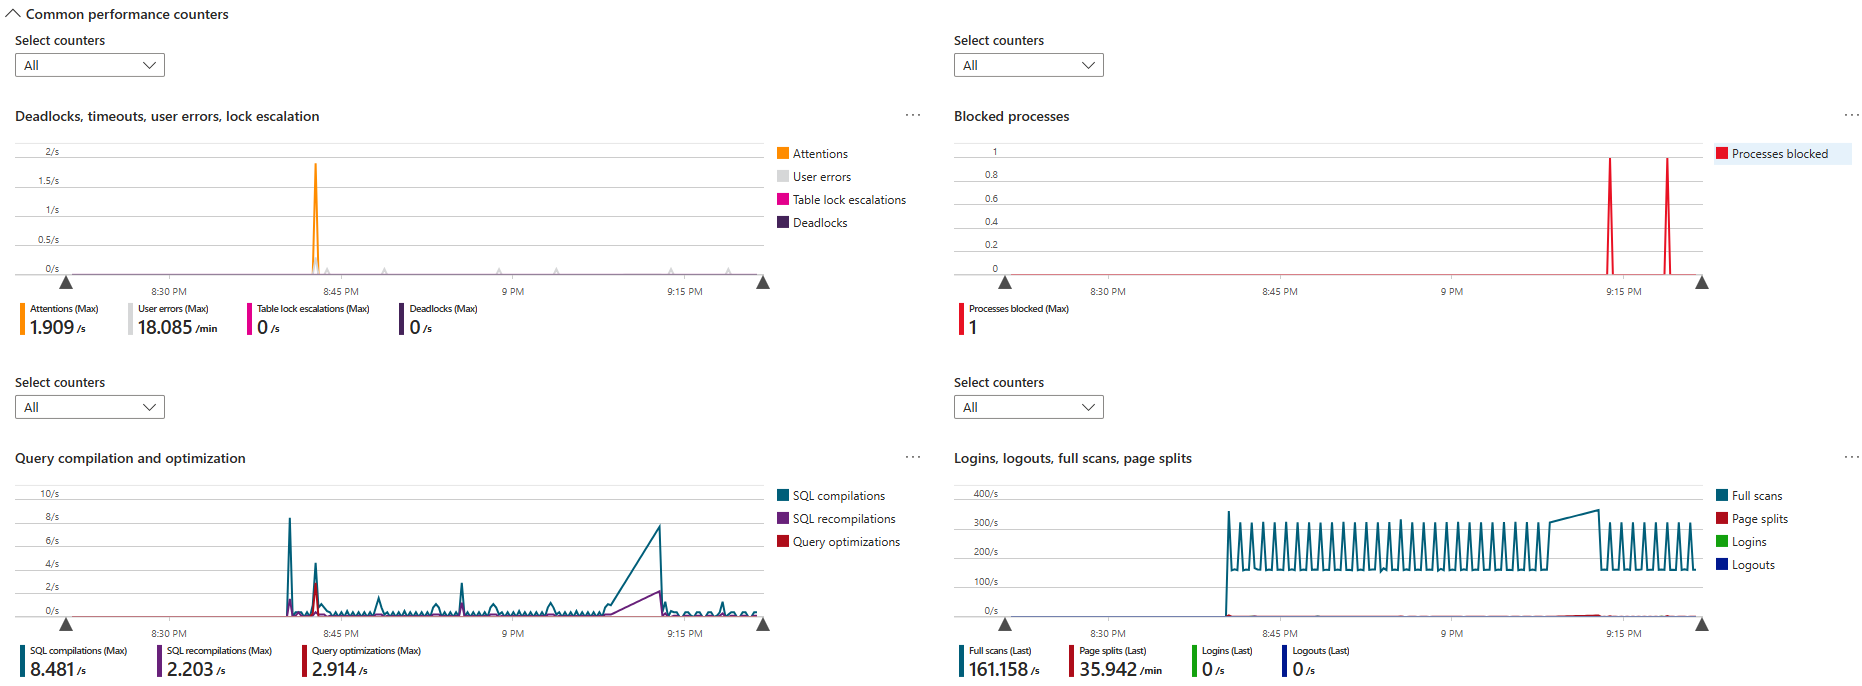
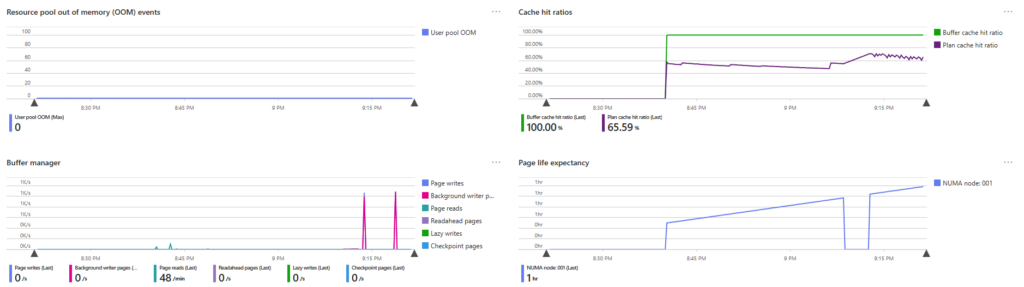
We also have access to performance counters :
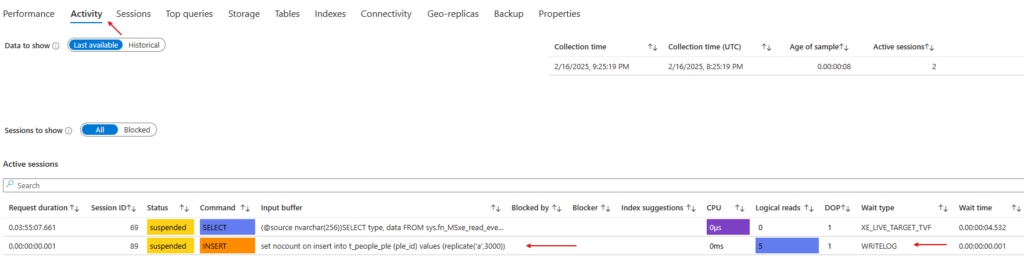
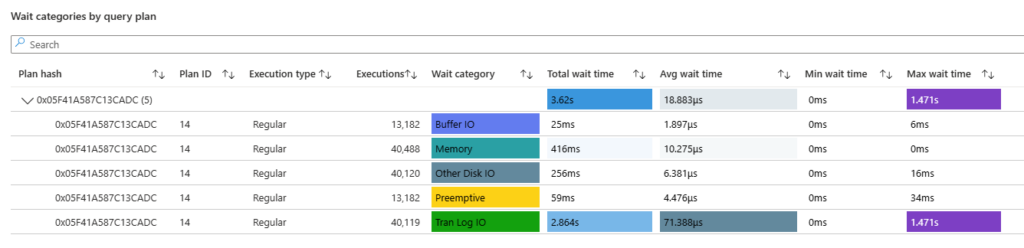
At the same time, we initiated a series of insertions on a sample table to generate activity. We can see that it has been identified and what type of waits it generates :
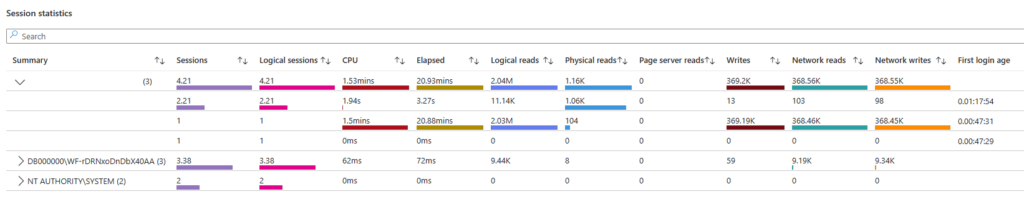
We also have access to sessions. The displayed view shows which sessions consume the most resources :

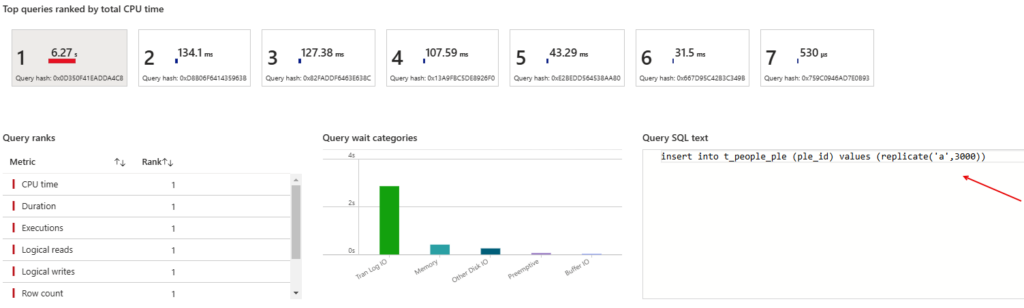
We were also able to easily retrieve the query that generated the most activity via the “Top queries” tab :

We also have some information about waits :
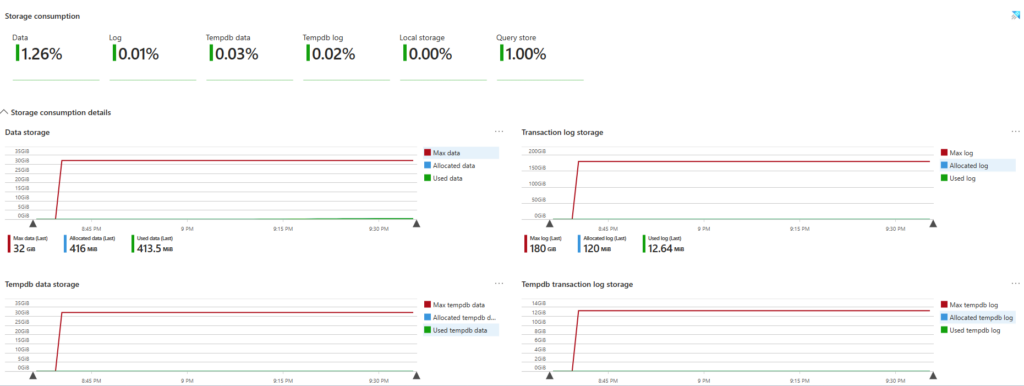
We have access the Storage section :
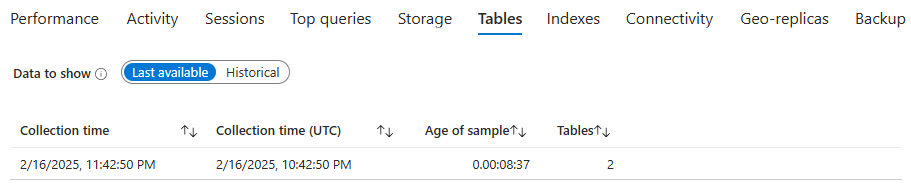
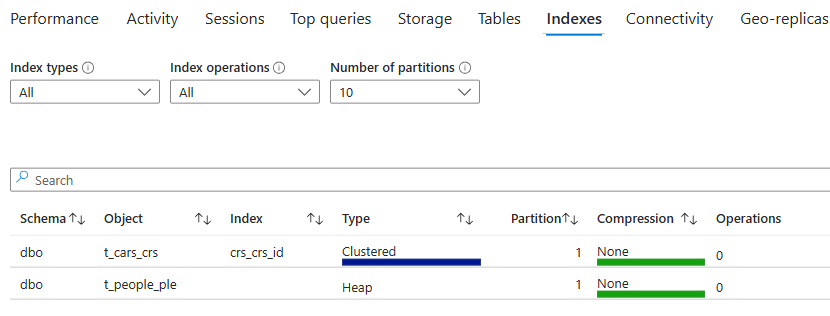
We also have access to the tables and indexes related to our database :

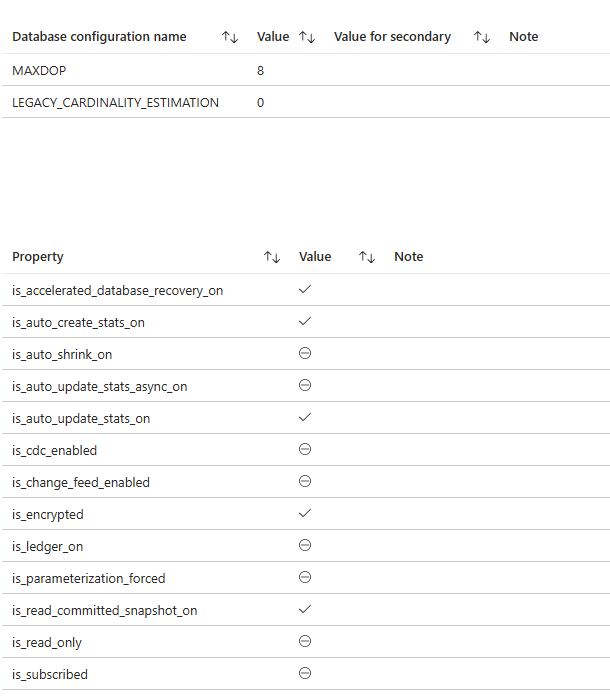
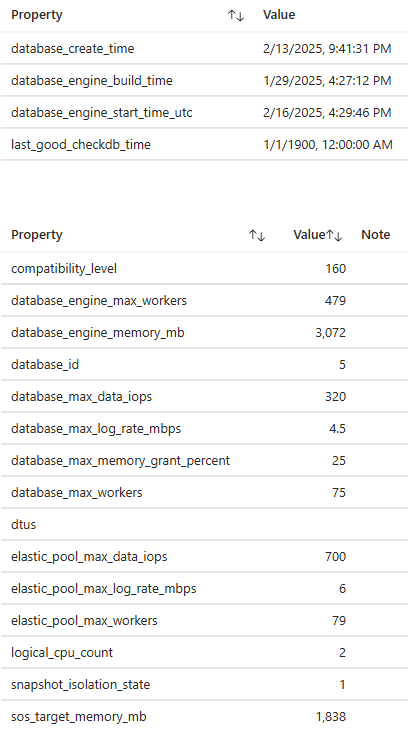
Finally, we can easily retrieve the properties of our database without having to query the tables and system views :
We can clearly see that we have a highly efficient and easy-to-use monitoring tool at our disposal.
Pricing
The “Database Watchers” and Dashboards components are free however the storage part via “Azure Data Explorer” or “Real-time analytics in Microsoft Fabric” is not free. Data transfer between different components is free as long as all components (target, watcher and data store) are in the same region. Unfortunately, this service is not yet available in Switzerland, but it is possible to deploy it in another region to monitor databases hosted in the “Switzerland North” region.
Thank you, Amine Haloui.
![Thumbnail [60x60]](https://www.dbi-services.com/blog/wp-content/uploads/2024/03/AHI_web.jpg)
![Thumbnail [90x90]](https://www.dbi-services.com/blog/wp-content/uploads/2022/08/STH_web-min-scaled.jpg)
![Thumbnail [90x90]](https://www.dbi-services.com/blog/wp-content/uploads/2022/11/TBR-web-min-scaled.jpg)
![Thumbnail [90x90]](https://www.dbi-services.com/blog/wp-content/uploads/2025/11/LTO_WEB.jpg)
![Thumbnail [90x90]](https://www.dbi-services.com/blog/wp-content/uploads/2023/01/APY_web-scaled.jpg)