SQL Server 2025 preview has been publicly available for a week now: you can find all the details in this blog “SQL Server 2025 Public Preview and SSMS 21 now available“.
In this blog, I want to make an highlight on one Engine High Availability (HA) feature: Availability Group Commit Time.
For a little background, Always On Availability Group (AG) is a feature released in SQL Server 2012.
This HA technology has benefited from numerous improvements over time, and most notably in SQL Server 2016 (automatic seeding, read-only replicas, dtc support, database health detection, distributed AG…).
To address a performance issue, SQL Server 2016 has introduced AG Commit Time. For nodes in synchronous mode, this concept reduces latency by specifying the time after which a transaction must be sent to the replicas.
If this value is not respected, it helps identifying possible bottlenecks between primary and secondary replicas: it improves monitoring and troubleshooting.
In some specific scenarios, this default value may not correspond business requirements when 10 ms delay (default value) is too high. As a result, SQL Server 2025 makes this value configurable through server configuration (availability group commit time).
Let’s look at how to change the configuration, and more interestingly, how to measure the impact of the new value.
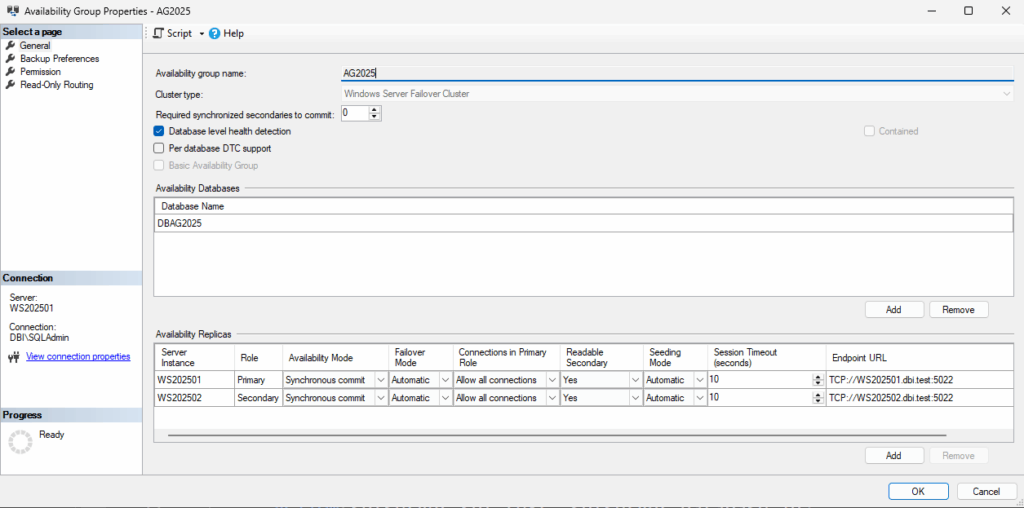
After downloading the latest version SQL Server Management Studio (SSMS) – release 21 – let’s connect to the Primary node. Here is my AG configuration (2 replicas + a fileshare witness):
As announced slightly before, this value is configurable at instance level:
SELECT name, value, value_in_use, is_advanced, is_dynamic
FROM sys.configurations WHERE name = 'availability group commit time (ms)'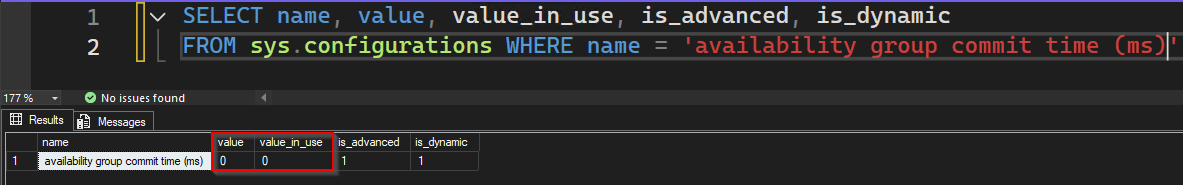
0 means default value is used: 10ms. To change this default value – let’s say 1 ms for the example – it can be done through the stored procedure sp_configure:
EXEC sp_configure 'show advanced options', '1';
RECONFIGURE;

EXEC sp_configure 'availability group commit time (ms)', '0'
RECONFIGURE;

EXEC sp_configure 'show advanced options', '0';
RECONFIGURE;

SELECT name, value, value_in_use, is_advanced, is_dynamic FROM sys.configurations
WHERE name = 'availability group commit time (ms)'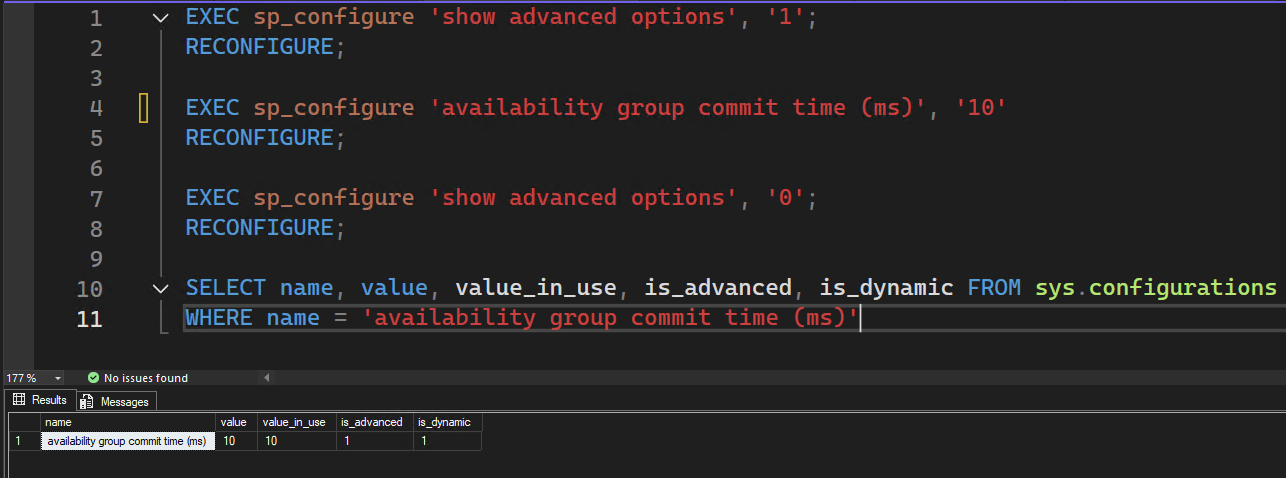
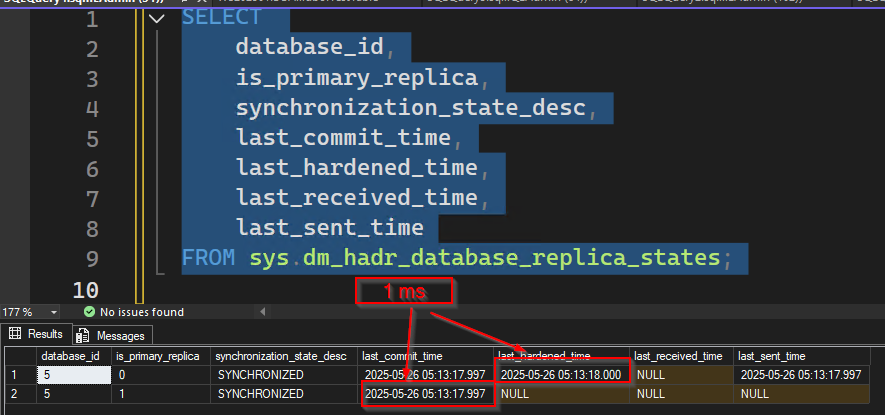
It is possible to use the DMV sys.dm_hadr_database_replica_states to get an idea of the AG commit time between Primary and Secondary:
SELECT
    database_id,
    is_primary_replica,
    synchronization_state_desc,
    last_commit_time,
    last_hardened_time,
    last_received_time,
    last_sent_time
FROM sys.dm_hadr_database_replica_states;
It is also possible to calculate the time between the hard_log_block is sent, and when the hard_receive_harden_lsn_message is received on the Primary.
To do so, let’s set up an Extended Events (XE) session:
CREATE EVENT SESSION [AG_Commit_Latency_Tracking] ON SERVER
ADD EVENT sqlserver.hadr_log_block_send_complete(
    ACTION(sqlserver.sql_text)
),
ADD EVENT sqlserver.hadr_receive_harden_lsn_message(
    ACTION(sqlserver.sql_text)
),
ADD EVENT sqlserver.hadr_log_block_group_commit(
    ACTION(sqlserver.sql_text)
)
ADD TARGET package0.event_file (
    SET filename = N'C:\Program Files\Microsoft SQL Server\MSSQL17.MSSQLSERVER\MSSQL\Log\AG_Commit_Latency.xel', max_file_size = 50, max_rollover_files = 5

)
WITH (STARTUP_STATE = ON);
GO

ALTER EVENT SESSION [AG_Commit_Latency_Tracking] ON SERVER STATE = START;
SELECT
event_data.value('(event/@name)[1]', 'varchar(100)') AS event_name,
event_data.value('(event/@timestamp)[1]', 'datetime2') AS [timestamp],
event_data.value('(event/action[@name="sql_text"]/value)[1]', 'nvarchar(max)') AS sql_text
FROM
(
SELECT CAST(event_data AS XML) AS event_data
FROM sys.fn_xe_file_target_read_file('C:\Program Files\Microsoft SQL Server\MSSQL17.MSSQLSERVER\MSSQL\Log\AG_Commit_Latency*.xel', NULL, NULL, NULL)
) AS events
ORDER BY [timestamp] DESC;
As both events are gathered on the Primary, the message received does not match exactly the time the secondary processed the message, but it gives a good idea if the duration is respected.
Keep in mind the default value (10 ms) is suitable for most workloads, as it is a good balance between performance and efficiency.
On the other hand, a lower value may just unbalance the load distribution on the primary, forcing it to synchronize more often than required; and it will benefit less from log block compression on the network.
![Thumbnail [60x60]](https://www.dbi-services.com/blog/wp-content/uploads/2022/08/NAC_web-min-scaled.jpg)
![Thumbnail [90x90]](https://www.dbi-services.com/blog/wp-content/uploads/2022/10/STS_web-min-scaled.jpg)
![Thumbnail [90x90]](https://www.dbi-services.com/blog/wp-content/uploads/2023/01/APY_web-scaled.jpg)
![Thumbnail [90x90]](https://www.dbi-services.com/blog/wp-content/uploads/2024/03/AHI_web.jpg)
![Thumbnail [90x90]](https://www.dbi-services.com/blog/wp-content/uploads/2025/11/LTO_WEB.jpg)