Are you experiencing performance problems with your Zyxel ZyWALL USG firewall? You will find in this blog an example of a real case I faced and how I solved it.
Introduction
From one day to the next, network performance deteriorated. Users first reported sporadic access problems and then these problems became permanent. The performance problems resulted in very slow access to a remote system. As shown below, the pings performed sometimes went up to more than a hundred milliseconds,
Pinging 8.8.8.8 with 32 bytes of data
Reply from 8.8.8.8: Bytes=32 time=12 ms TTL=116
Reply from 8.8.8.8: Bytes=32 time=63 ms TTL=116
Reply from 8.8.8.8: Bytes=32 time=12 ms TTL=116
Reply from 8.8.8.8: Bytes=32 time=562 ms TTL=116
Reply from 8.8.8.8: Bytes=32 time=519 ms TTL=116
Reply from 8.8.8.8: Bytes=32 time=211 ms TTL=116
Reply from 8.8.8.8: Bytes=32 time=31 ms TTL=116
Reply from 8.8.8.8: Bytes=32 time=617 ms TTL=116
Reply from 8.8.8.8: Bytes=32 time=100 ms TTL=116
Reply from 8.8.8.8: Bytes=32 time=19 ms TTL=116
Thanks to UDITIS, we were able to quickly isolate the problem and understood that it came from the firewall. In this case it was a ZyWALL USG 50 firewall.
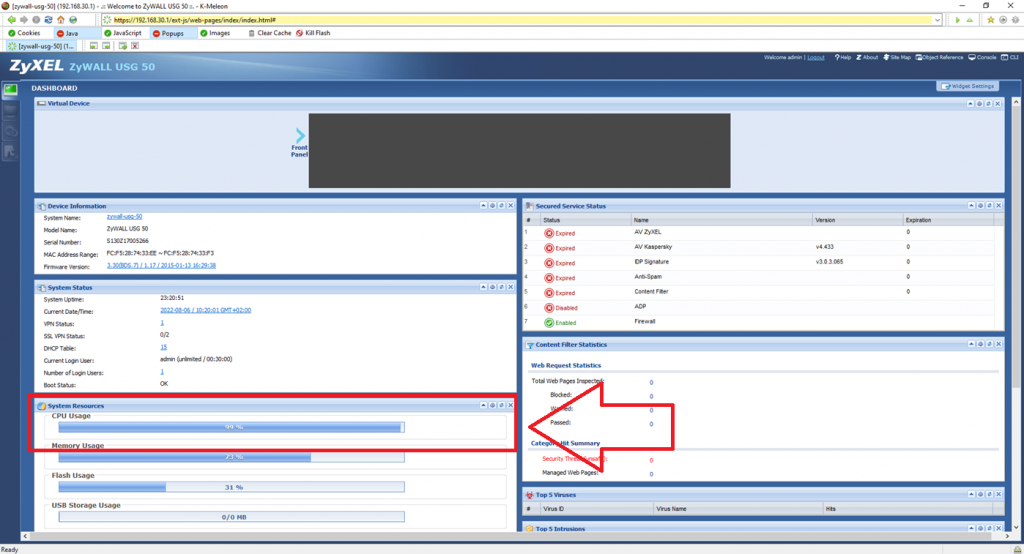
Logging into the ZyWALL USG GUI, we quickly saw that the processor resources were being used at over 90%. This had an impact on packet processing.
Problem analysis
Unfortunately the ZyWALL graphical interface does not give more details about the use of resources and does not allow to see what the processor or memory resources are used for. To analyze the problem, it is therefore necessary to connect to the Zywall via SSH.
As explained on the Zyxel support webpage, we can use the command line “debug system show cpu status” to see the CPU usage details. For instance, if CPU time would have been spent on “softirq” it would have mean that the CPU was occupied with traffic load. In our case the CPU is occupied with a system item (currentrly 51%) and by user (currently 47%).
login as: admin
Using keyboard-interactive authentication.
Password:
Bad terminal type: "xterm". Will assume vt100.

Router> debug system show cpu status
CPU utilization: 99 % (system: 51 %, user: 47 %, irq: 0 %, softirq 1 %)
CPU utilization (1 minute): 98 % (system: 48 %, user: 43 %, irq: 4 %, softirq 3 %)
CPU utilization (5 minute): 98 % (system: 47 %, user: 44 %, irq: 4 %, softirq 3 %)
To understand why the CPU is used by system item, we can use the command “debug system ps“. This command will help to see the different processes and the resources usage as presented below (extract).
Router> debug system ps
USER       PID %CPU %MEM    VSZ   RSS TTY      STAT START   TIME COMMAND
root         1  0.0  0.0    208   100 ?        Ss   Aug05   0:02 ini
root         2  0.0  0.0      0     0 ?        S<   Aug05   1:01 [kthreadd]
root       816  0.3  0.5   8464  1240 ?        Ss   Aug05   5:20 /usr/sbin/zylogd
root       820  0.0  0.1   1104   444 ?        Ss   Aug05   0:05 /usr/sbin/syslog-ng -f /var/zyxel/syslog-ng/syslog-ng.conf
root      1527  0.0  0.1   3760   404 ?        S    Aug05   0:00 /usr/sbin/pcap_monitor
root      1533  0.0  0.1   8920   340 ?        Ss   Aug05   0:00 /usr/sbin/vsd
root      1536  0.0  0.1   2588   276 ?        S<   Aug05   0:00 /bin/zyshd_wd
root      1540  0.3  4.8  54304 11708 ?        S    Aug05   5:00 /bin/zyshd
root      1696  0.0  0.2   7068   664 ?        Ss   Aug05   0:00 /usr/sbin/xinetd -filelog /tmp/xinetd.log -stayalive -reuse -pidfile /var/run/xinetd.pid
root      1807  0.0  1.0  50108  2456 ?        Ss   Aug05   0:00 /usr/sbin/radiusd -d /var/zyxel/raddb
root      2297  0.0  0.1   2704   408 ?        S<   Aug05   0:00 /sbin/resd
root      2303  0.0  0.8  35436  1944 ?        Ss   Aug05   0:04 /usr/sbin/contfltd
root      2382  0.0  0.0   2572   196 ?        Ss   Aug05   0:00 /sbin/lavd
root      2383  0.0  1.1  15836  2768 ?        S<   Aug05   0:00 /sbin/decomp_server
root      2397  0.0  0.2  16212   632 ?        Ss   Aug05   0:00 /usr/sbin/fauthd
root      2412  0.0  0.1   2772   320 ?        S<   Aug05   0:00 /sbin/wdtd
...
...
nobody   12843  0.0  1.5  41860  3804 ?        S    Aug05   0:00 /usr/local/apache/bin/httpd -f /usr/local/zyxel-gui/httpd.conf -k start -DSSL
nobody   12851  0.0  1.5  41860  3688 ?        S    Aug05   0:00 /usr/local/apache/bin/httpd -f /usr/local/zyxel-gui/httpd.conf -k start -DSSL
nobody   12852  0.0  1.6  44004  4108 ?        S    Aug05   0:00 /usr/local/apache/bin/httpd -f /usr/local/zyxel-gui/httpd.conf -k start -DSSL
root     20680 91.9  1.2  26976  3076 ?        R    10:18   4:31 /usr/local/sbin/snmpd udp:161,udp6:161 -c /var/zyxel/snmpd.conf -p /var/run/snmpd.pid
...
...
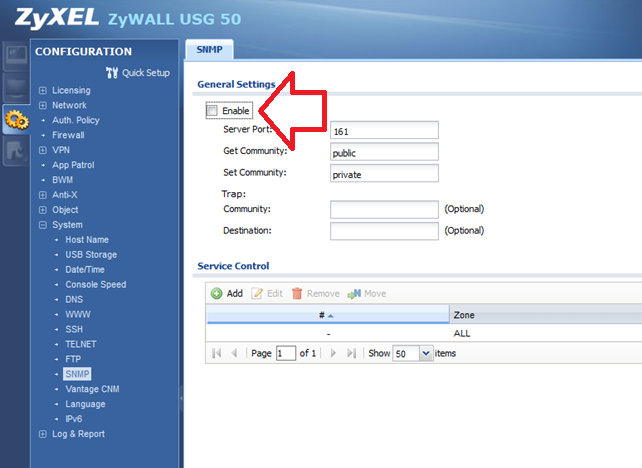
As you can see, the SNMP process is using 91.9% of CPU usage. SNMP monitoring can be used to collect information from your USG. If you do not need it you can simply deactivate it through the graphical interface. In addition, it looks to be a good practice on the USG when not using this feature. In order to deactivate the SNMP functionality just go in Configuration section and then in System > SNMP as shown below:
Once SNMP deactivated, Processor usages are freed up.
Router> debug system show cpu status
CPU utilization: 12 % (system: 5 %, user: 2 %, irq: 3 %, softirq 2 %)
CPU utilization (1 minute): 78 % (system: 39 %, user: 33 %, irq: 3 %, softirq 3 %)
CPU utilization (5 minute): 92 % (system: 45 %, user: 41 %, irq: 3 %, softirq 3 %)
The pings are now much more stable and there are no more spikes as we saw at the beginning.
Pinging 8.8.8.8 with 32 bytes of data
Reply from 8.8.8.8: Bytes=32 time=12 ms TTL=116
Reply from 8.8.8.8: Bytes=32 time=11 ms TTL=116
Reply from 8.8.8.8: Bytes=32 time=12 ms TTL=116
Reply from 8.8.8.8: Bytes=32 time=11 ms TTL=116
Reply from 8.8.8.8: Bytes=32 time=12 ms TTL=116
...
...
Reply from 8.8.8.8: Bytes=32 time=12 ms TTL=116
Reply from 8.8.8.8: Bytes=32 time=12 ms TTL=116
Reply from 8.8.8.8: Bytes=32 time=12 ms TTL=116
Reply from 8.8.8.8: Bytes=32 time=12 ms TTL=116
Reply from 8.8.8.8: Bytes=32 time=12 ms TTL=116
Conclusion
In the event of a performance problem with a ZyWALL USG, the command line tool provided by ZyXEL allows you to understand what resources are being monopolized by. Once you have identified what was consuming the resources, in our case the SNMP process, you can either stop it or go further in the debugging process.
![Thumbnail [60x60]](https://www.dbi-services.com/blog/wp-content/uploads/2022/08/GRS_web-min-scaled.jpg)
![Thumbnail [90x90]](https://www.dbi-services.com/blog/wp-content/uploads/2022/10/STS_web-min-scaled.jpg)
![Thumbnail [90x90]](https://www.dbi-services.com/blog/wp-content/uploads/2024/03/AHI_web.jpg)
![Thumbnail [90x90]](https://www.dbi-services.com/blog/wp-content/uploads/2025/11/LTO_WEB.jpg)
![Thumbnail [90x90]](https://www.dbi-services.com/blog/wp-content/uploads/2025/05/martin_bracher_2048x1536.jpg)