In today’s data-driven economy, downtime isn’t just an IT headache; it’s a direct hit to your bottom line. As modern environments grow more complex, spanning hybrid clouds, edge devices, and massive enterprise clusters, Zabbix monitoring provides the single source of truth IT teams need.
The biggest challenge for IT Managers today isn’t a lack of data; it’s fragmentation. Using one tool for Linux, another for Windows, and a third for your databases creates “blind spots.”
This is why Zabbix is our solution of choice. It bridges these disparate environments into a unified, proactive operational strategy.
What is Zabbix?
Zabbix is an open-source platform built to track the speed, capacity, and uptime of network devices, servers, virtual machines, and cloud apps.
Unlike paid platforms that use strict “per-node” pricing, which quickly drives up your costs as you grow, Zabbix offers a complete solution. In fact, whether you manage 10 servers or scale across 10,000 remote devices, Zabbix gives you full visibility without any extra license fees.
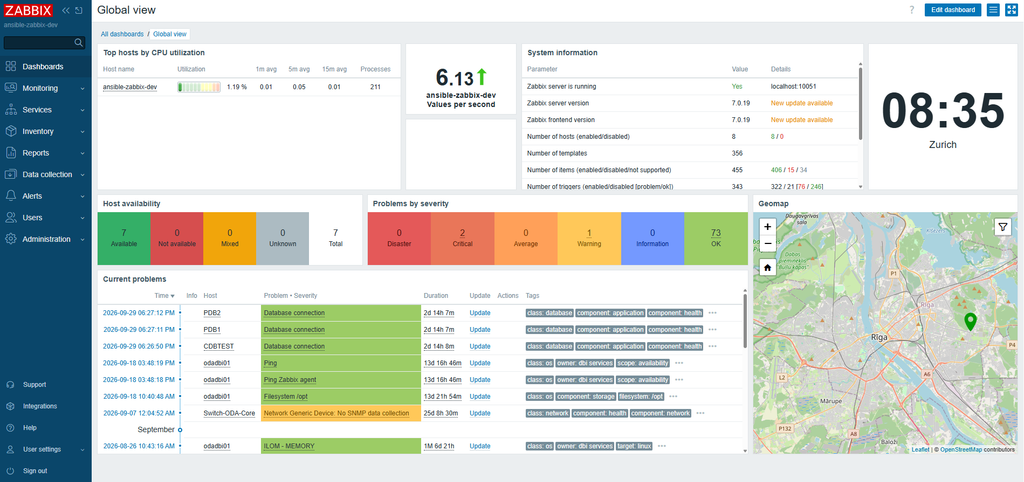
Unified Zabbix Monitoring Across Every Platform
The main strength of Zabbix lies in its flexibility. First, it simplifies complex systems, giving you the same clear view whether your tasks run on old physical hardware or modern containers.
1. Multi-Database Performance Tracking
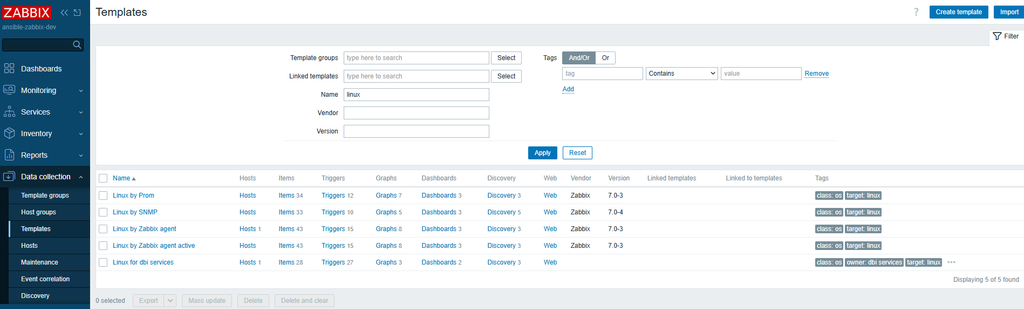
Database health is vital for your business. For this reason, Zabbix provides ready-to-use templates made specifically for popular database systems:
- MSSQL: Track buffer cache hit ratios, active connections, and lock wait times.
- PostgreSQL: Monitor table bloat, transaction throughput, replication lag, and query execution speeds.
- Oracle: Deep-dive into SGA/PGA memory usage, tablespace utilization, and archivelog generation rates.
2. Bridging the Gap Between OS: Linux & Windows
In many organizations, system administrators and Windows engineers operate in separate toolsets. However, Zabbix works as the universal translator:
- For Linux Systems: Collect low-level kernel stats, disk I/O wait times, load averages, and critical process statuses via the lightweight Zabbix Agent.
- For Windows Environments: Tap natively into WMI (Windows Management Instrumentation) and Performance Counters to track system services, Active Directory health, and Event Logs.
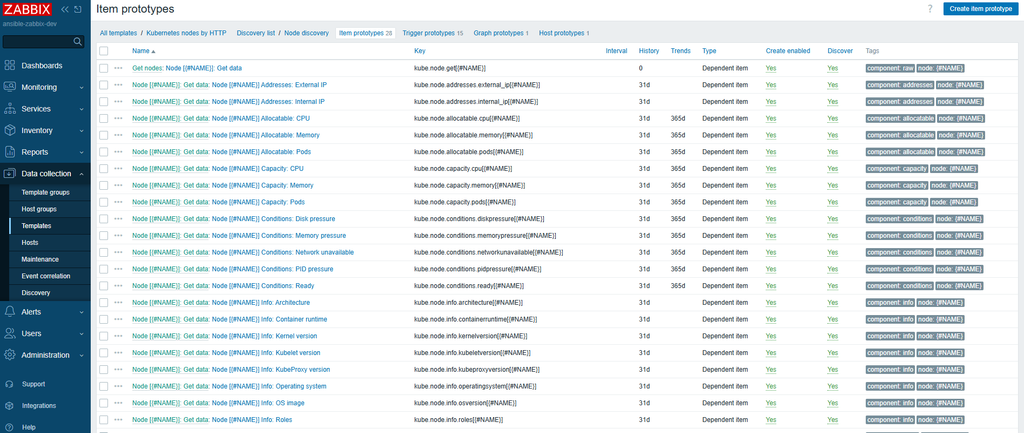
3. Modern Cloud & Container Visibility with Kubernetes
Moving to cloud containers can often make it hard to see what is happening in your apps. Fortunately, Zabbix gives you complete control back. As a result, you can automatically find and track container pods, server workloads, and cloud APIs right alongside your physical servers.
Key Features That Drive Enterprise Zabbix Monitoring
Why does Zabbix excel where other open-source tools require complex add-ons?
- Low-Level Discovery (LLD): Zabbix automatically discovers file systems, network interfaces, and database instances dynamically, significantly reducing repetitive configuration tasks.
- Distributed Proxies: Deploy Zabbix proxies to collect and buffer monitoring data locally in remote locations or segmented networks, while simplifying network communication with the central server.
- Automated Remediation: Beyond simple alerts, Zabbix can trigger execution scripts automatically to restart failed services or clear temporary cache files before end users are impacted.
Why Centralizing with Zabbix Monitoring Wins
Deploying a single Zabbix platform offers clear operational advantages:
- Faster Root Cause Analysis: For example, if a PostgreSQL database experiences high query latency, is the bottleneck inside the SQL code or caused by underlying storage I/O? Because all metrics reside within Zabbix, engineers can cross-correlate hardware telemetry with software metrics instantly.
- Unified Alert Management: Eliminate alert fatigue. Centralize notifications through integrations with Slack, Microsoft Teams, PagerDuty, or custom Webhooks.
- Predictable Cost Scale: Also, eliminate per-agent software licenses. Consequently, Zabbix scales alongside your enterprise infrastructure with no hidden software costs.
Conclusion: Achieve Visibility Without Limits
As infrastructure consultants, our goal is to convert complex IT environments into transparent, manageable assets. Whether you operate a dedicated Oracle database estate, a multi-tenant Windows domain, or a modern hybrid Kubernetes cloud, Zabbix monitoring provides the proactive visibility required to resolve incidents before they degrade performance.
In short, we don’t just monitor server uptime; we safeguard the availability of your business operations.
You can find other blogs regarding Zabbix or other topics at this link: dbi blogs
![Thumbnail [60x60]](https://www.dbi-services.com/blog/wp-content/uploads/2023/01/DAL_web-scaled.jpg)
![Thumbnail [90x90]](https://www.dbi-services.com/blog/wp-content/uploads/2022/09/DDI_web-min-scaled.jpg)
![Thumbnail [90x90]](https://www.dbi-services.com/blog/wp-content/uploads/2023/01/APY_web-scaled.jpg)