During a healthcheck at a client’s site, we collected performance data from a SQL Server 2019 Enterprise instance hosting a BI / data warehouse workload. Two lines in the wait statistics report immediately caught the eye: hundreds of hours of parallelism waits accumulated in only 11 days of uptime.
Here are the questions that arise
- Can a wait type really account for more than 100% of server uptime?
- Are these values a problem in themselves?
- What do they tell us about the configuration of the instance?
The waits themselves were not the problem. But they pointed us to a BIOS option (Sub-NUMA Clustering) that was silently reshaping the entire NUMA topology of the server and putting it in conflict with the MAXDOP configuration.
This post is the story of that investigation: from the wait statistics to the BIOS, step by step.
Unusual wait statistics
The collected data
The instance had been up for about 11 days (roughly 273 hours). The two top wait types were:
| Wait type | % of uptime | Total hours | Average per wait |
| CXCONSUMER | 278.95% | 761.91 h | 0 ms |
| CXPACKET | 240.83% | 657.78 h | 1 ms |
761 hours is almost 32 days. How can a server accumulate 32 days of waits in 11 days of wall-clock time?
Reading percentages above 100%
Wait statistics are cumulated across all threads that are waiting at the same time. A waiting thread is in the SUSPENDED state: it does not occupy a scheduler, so the number of simultaneous waiters is not limited by the number of CPUs. It is only limited by the worker thread pool (704 workers on this instance).
A simple example: 16 threads, each waiting for one hour during one hour of wall-clock time, produce 16 hours of wait time for 1 hour of uptime. That is 1600%.
This gives us the only robust way to read these percentages: divide by 100 to get the average number of threads simultaneously waiting on that wait type.
- CXCONSUMER: 761.91 h / 273 h ≈ 2.79 → about 2.8 threads permanently waiting
- CXPACKET: 657.78 h / 273 h ≈ 2.41 → about 2.4 threads permanently waiting
On a server that can host 704 workers, 2.5 permanent waiters is not an alarming number.
CXPACKET and CXCONSUMER
Both wait types belong to parallel query execution. A parallel plan splits its work into branches and the branches synchronize at exchange operators.
- CXCONSUMER: the consumer side of an exchange is simply waiting for the producers to deliver rows. This is the structural, unavoidable wait of any parallel plan. It is considered benign.
- CXPACKET: a thread has finished its share of the work and waits for slower branches at the synchronization point. This is the potentially actionable signal: it reveals an imbalance between the branches of the plan.
An analogy: in a factory, CXCONSUMER is a workstation waiting for parts to arrive (normal), CXPACKET is a workstation that has finished its batch and waits for a slower colleague (an imbalance worth examining).
Are these values abnormal, then?
Look at the averages again: 0.00 ms and 1.00 ms per wait. 657.78 hours at 1 ms average means roughly 2.4 billion individual waits. These counters do not describe long blockings, they describe the normal tick-tock of exchange operators in a heavily parallel workload. A server suffering from severe skew would show averages of tens of milliseconds.
The healthcheck tool itself says it in its own message: “Usually a cost threshold for parallelism / MAXDOP tuning issue rather than a problem in itself.” The line is an inventory entry (any wait above 10% of uptime gets reported), not an alarm.
So why did these two lines matter? Not because of their height because of their rank. CXCONSUMER and CXPACKET were number 1 and number 2 of the entire wait inventory, ahead of everything else. Their rank designated parallelism as the dominant workload of this instance and therefore its configuration as the first thing to confront with the topology.
The instance configuration
SELECT [name], value_in_use
FROM sys.configurations
WHERE [name] IN (N'max degree of parallelism', N'cost threshold for parallelism'); - Cost threshold for parallelism: 50, correctly raised from the default of 5. This setting decides which queries are allowed to go parallel (those whose estimated cost exceeds the threshold).
- MAXDOP: 8, this setting decides how wide: the maximum number of worker threads per parallel branch.
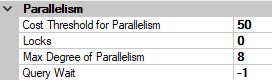
MAXDOP 8 is a perfectly reasonable value in isolation. The problem only appears when we look at the topology.
The topology
SELECT cpu_count, hyperthread_ratio, socket_count, cores_per_socket,
numa_node_count, softnuma_configuration_desc
FROM sys.dm_os_sys_info; 
Two sockets. Four NUMA nodes. That is the anomaly this whole post is about.
From the anomaly to the root cause
On modern processors, there is no central memory controller shared by all cores. Each processor package has its own memory controllers with its own RAM modules attached to them. Such a group (cores + memory controllers + local RAM) is a NUMA node.
When a core reads an address that lives in its own node’s RAM: direct path, fast. When it reads an address that lives in another node’s RAM: the request crosses the interconnect, with roughly 1.5 to 2 times the latency. That is the meaning of the name: Non-Uniform Memory Access. The cost of a memory access depends on the physical distance between the core that asks and the RAM module that answers.
The natural NUMA boundary is therefore the socket: one socket = its memory controllers = its local RAM = one NUMA node.
Here we have 4 nodes for 2 sockets: 2 nodes per socket. Only three mechanisms can produce that:
| Suspect | Signature | Conclusion |
| Soft-NUMA (SQL Server subdivides by itself) | softnuma_configuration_desc <> OFF and soft-NUMA only splits schedulers, the memory nodes stay at the hardware count | OFF |
| Multi-die silicon (e.g. AMD EPYC Naples: 4 dies per socket) | CPU identity | Intel Xeon Gold 6244 = monolithic die |
| A BIOS option that subdivides the socket | On this Intel generation: Sub-NUMA Clustering | The only suspect left |
Cross-checking with the hardware
The server is a physical HPE ProLiant DL380 Gen10 with 2 × Intel Xeon Gold 6244 (8 cores / 16 threads each, 3.60 GHz base) and 384 GB of RAM (12 × 32 GB, balanced across the memory channels).
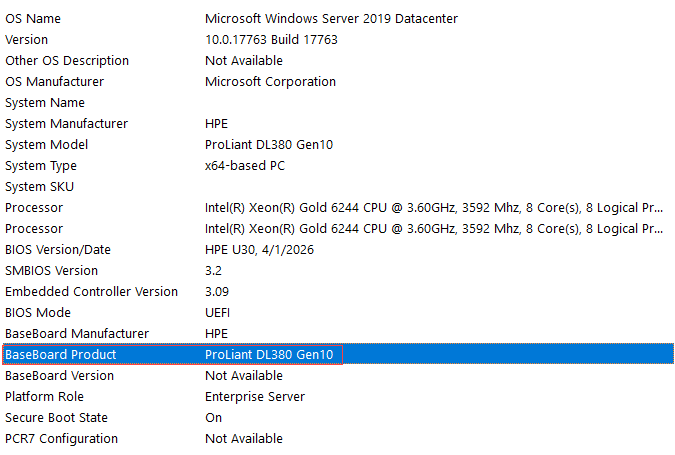
Windows server shows “8 Core(s), 8 Logical Processor(s)” per socket, and Task Manager shows Cores: 16 = Logical processors: 16. Hyper-threading is disabled: 16 physical cores, one logical processor per core. This matters for the rest of the post, because Microsoft’s MAXDOP recommendations are expressed in logical processors per node.
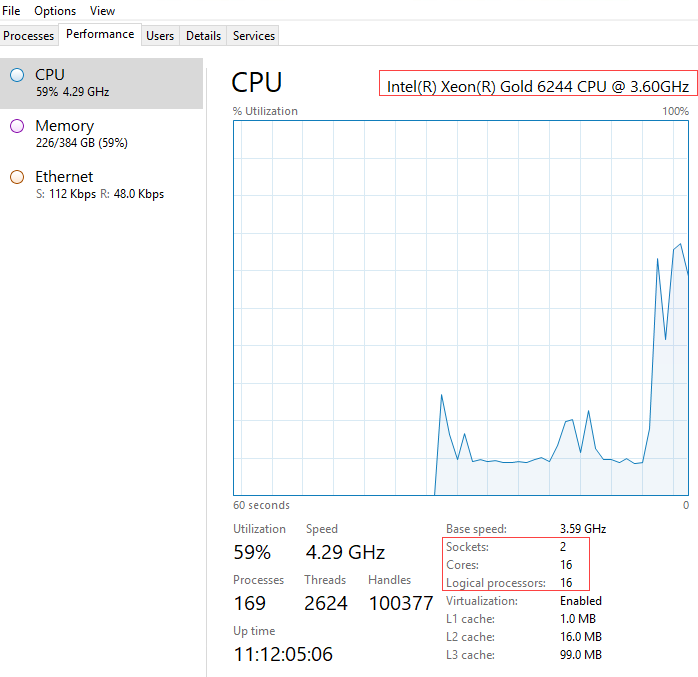
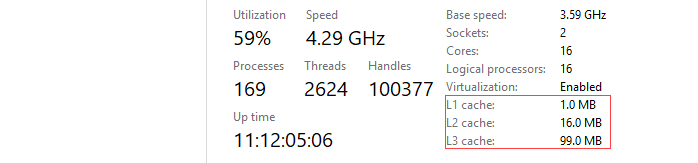
A corroborating detail: Task Manager reports L3 cache = 99.0 MB. The Gold 6244 has 24.75 MB of L3 per socket, so the server has 49.5 MB but 99.0 = 4 × 24.75. Windows counts the socket’s L3 once per NUMA node it is presented with. The only wrong line in the cache arithmetic is exactly the one that depends on NUMA counting.
What Sub-NUMA Clustering is
Our socket contains 8 cores, 6 memory channels and a shared L3 cache connected by an internal mesh. Sub-NUMA Clustering (SNC) is a BIOS option that cuts this socket into two domains, each with 4 cores, 3 memory channels and its half of the L3 affinity and presents each half as a full NUMA node to the operating system.
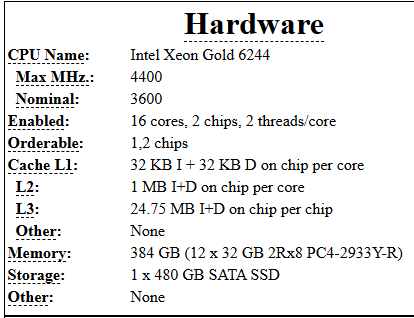
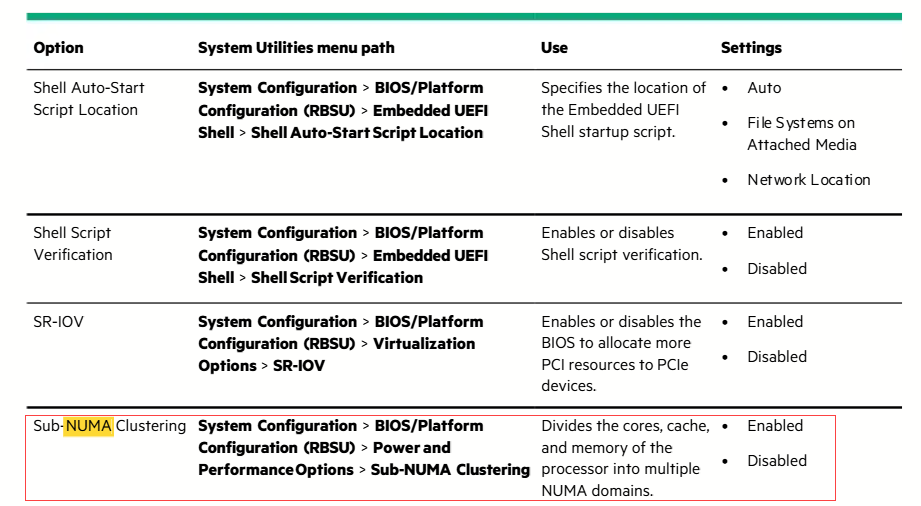
Two sockets × SNC = 4 NUMA nodes of 4 logical processors and about 96 GB of RAM each. Exactly what our DMVs show.
Why does this option exist? Because for some workloads it helps. A public SPEC CPU2017 result published by Dell on the equivalent platform (PowerEdge R640, same 2 × Xeon Gold 6244, same 384 GB in 12 × 32 GB) is instructive on this point the BIOS notes literally list “Sub NUMA Cluster enabled” and the published numactl output shows the resulting topology:
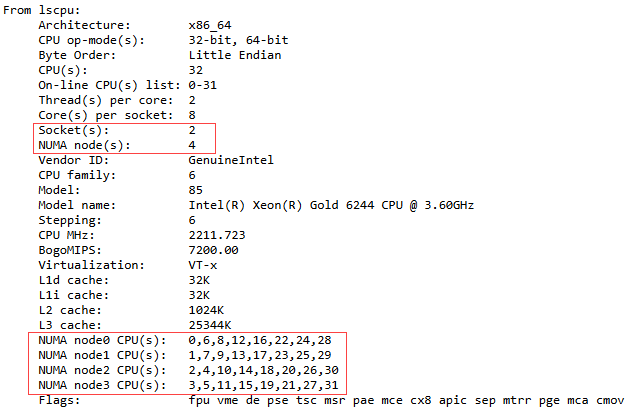

Reference : https://www.spec.org/cpu2017/results/res2019q2/cpu2017-20190429-12798.html
What SNC makes SQLOS build
At startup, SQLOS mirrors the presented topology: one memory node and one group of schedulers per NUMA node. On this server: 4 groups of 4 schedulers and the decisive point the buffer pool is partitioned across the 4 nodes. With max server memory at 210 GB, each node manages roughly 52 GB, and a cached data page physically lives in the RAM of one node.
The mechanics then the corrections
Now we can close the loop with Part 1:
- SNC (BIOS) cuts 2 sockets into 4 NUMA nodes of 4 logical processors.
- MAXDOP is 8 and a node only offers 4 schedulers: every parallel query spans two nodes by construction at every execution.
- The workers on the remote node access non-local memory. This cost is mostly invisible in the wait statistics a thread reading remote memory is RUNNING, not waiting. The direct cost hides in queries that simply run slower.
- Only the indirect effect surfaces: asymmetric memory distances desynchronize the branches, the fast workers finish their packets and wait for the slow ones at the exchanges and that spills into CXPACKET.
- The placement follows the load of the moment, so the same query can have different costs from one execution to the next. SNC does not only add cost it adds variance.
Why MAXDOP 4 alone is not the fix
Capping MAXDOP at 4 confines each query’s workers to a single node. That offers two things: the working memory (memory grants, hash tables, sort runs, exchange buffers) becomes local and all branches advance at the same speed and nobody waits for a remote colleague anymore.
But it does not buy data locality. A buffer pool page is allocated on the node of the worker that read it from disk potentially days ago for another query on another node and it never migrates afterwards. With 4 nodes, a query confined to node 2 finds on average only about 25% of the already-cached pages locally. And MAXDOP 4 also halves the width of every query on a data warehouse that lives on parallelism. MAXDOP 4 is the bandage. The correction is the topology itself.
Microsoft’s recommendations
| Configuration | MAXDOP recommendation |
| Single NUMA node, ≤ 8 logical processors | ≤ number of logical processors |
| Single NUMA node, > 8 logical processors | 8 |
| Multiple NUMA nodes, ≤ 16 logical processors per node | ≤ number of logical processors per node |
| Multiple NUMA nodes, > 16 logical processors per node | Half the logical processors per node, max 16 |
Our server sits on the third line in every scenario:
| Scenario | Topology | MAXDOP recommendation |
| Today (SNC enabled) | 4 nodes × 4 logical processors | ≤ 4 (currently 8: non-compliant) |
| SNC disabled | 2 nodes × 8 logical processors | ≤ 8 → the current setting becomes compliant |
Current (SNC enabled) :
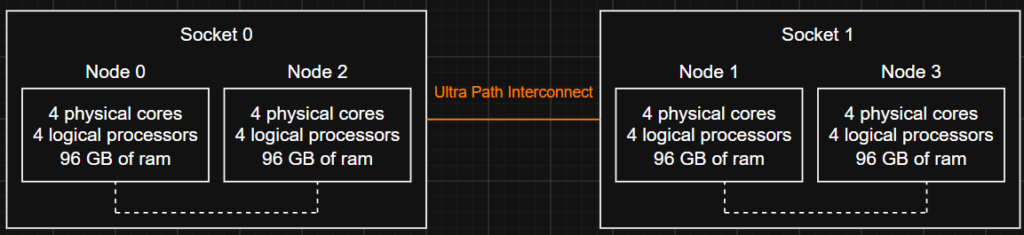
After (with SNC disabled) :
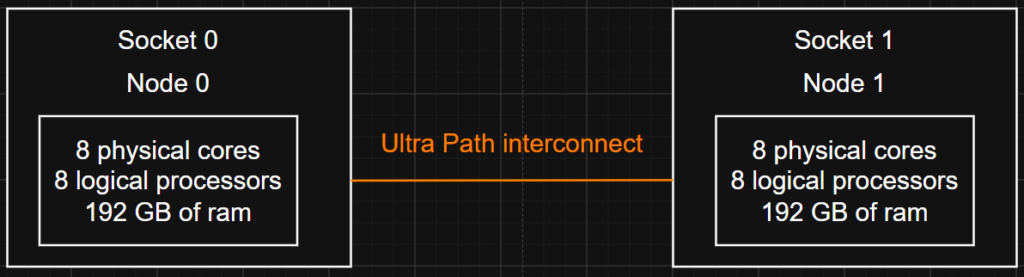
The possible two corrections:
Short term (online, reversible, no restart): MAXDOP = 4. It confines each query to one node as the server is presented today. It is a transitional measure not the target state.
EXEC sp_configure 'max degree of parallelism', 4;
RECONFIGURE;
Root-cause correction (through a maintenance window): disable SNC in the BIOS. On an HPE Gen10, the option lives in:
System Configuration > BIOS/Platform Configuration (RBSU) > Power and Performance Options > Sub-NUMA Clustering > Disabled
It looks like that:
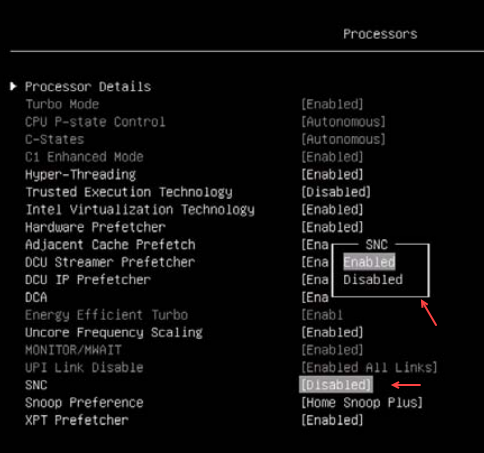
Reference : https://lenovopress.lenovo.com/lp1499.pdf
Conclusion
The wait statistics never proved anything in this story and that is the point. Values above 100% of uptime are normal (they cumulate across all simultaneous waiters), the averages were small and CXCONSUMER is benign by nature. What the two lines provided was a characterization: normalized by uptime, they showed about 2.5 threads permanently synchronizing exchanges and this instance lives on parallelism. Their rank designated parallelism as the dominant workload and therefore its configuration as the first thing to confront with the topology.
Thank you. Amine Haloui
![Thumbnail [60x60]](https://www.dbi-services.com/blog/wp-content/uploads/2024/03/AHI_web.jpg)
![Thumbnail [90x90]](https://www.dbi-services.com/blog/wp-content/uploads/2025/11/LTO_WEB.jpg)