Skip to content

ASH

Oracle ASH SQL_PLAN_LINE_ID in adaptive plans

There are several methods to find out where time is spent in an execution plan of a query running in an Oracle database. Classical methods like SQL Trace and running a formatter tool like tkprof on the raw trace, or newer methods like SQL Monitor (when the Tuning Pack has been licensed) or running a query with the GATHER_PLAN_STATISTICS-hint (or… 

Drilling down the pgSentinel Active Session History

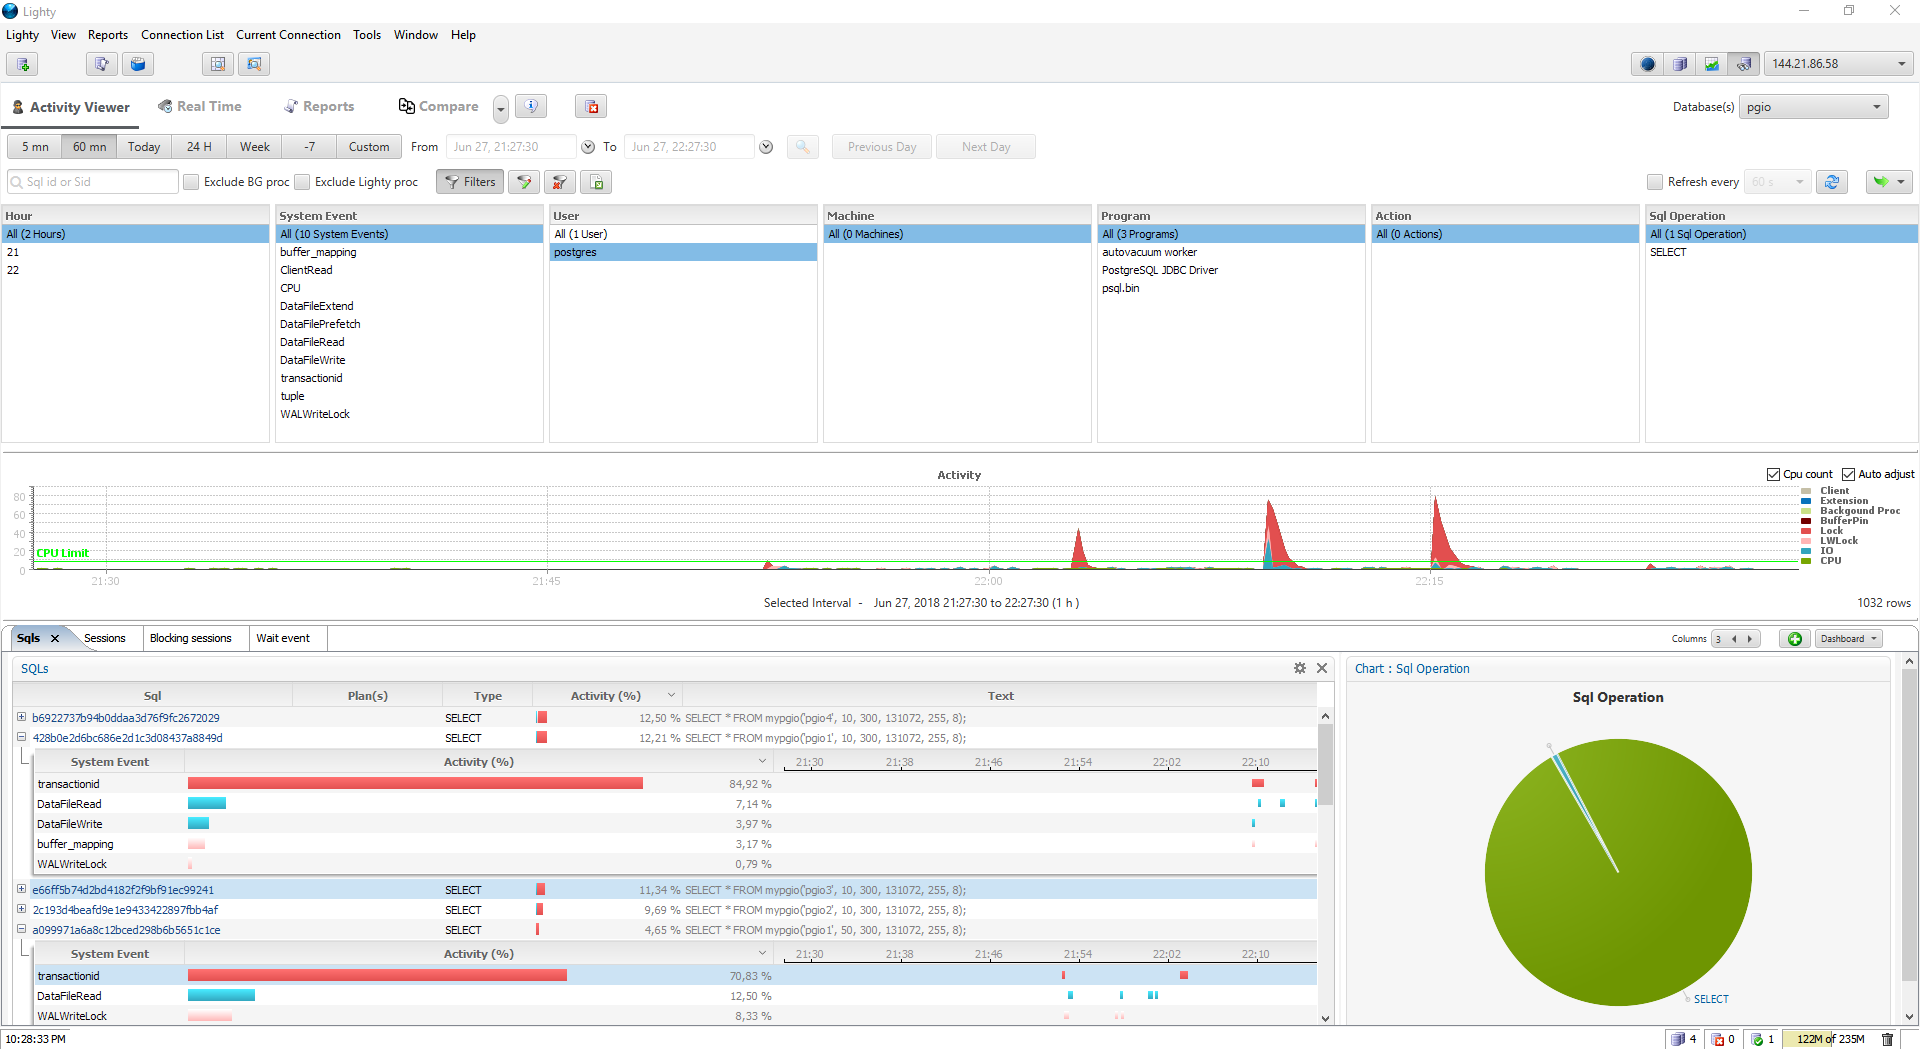
By Franck Pachot . In pgSentinel: the sampling approach for PostgreSQL I mentioned that one of the advantages of the ASH approach is the ability to drill down from an overview of the database activity, down to the details where we can do some tuning. The idea is to always focus on the components which are relevant to our tuning… 

pgSentinel: the sampling approach for PostgreSQL

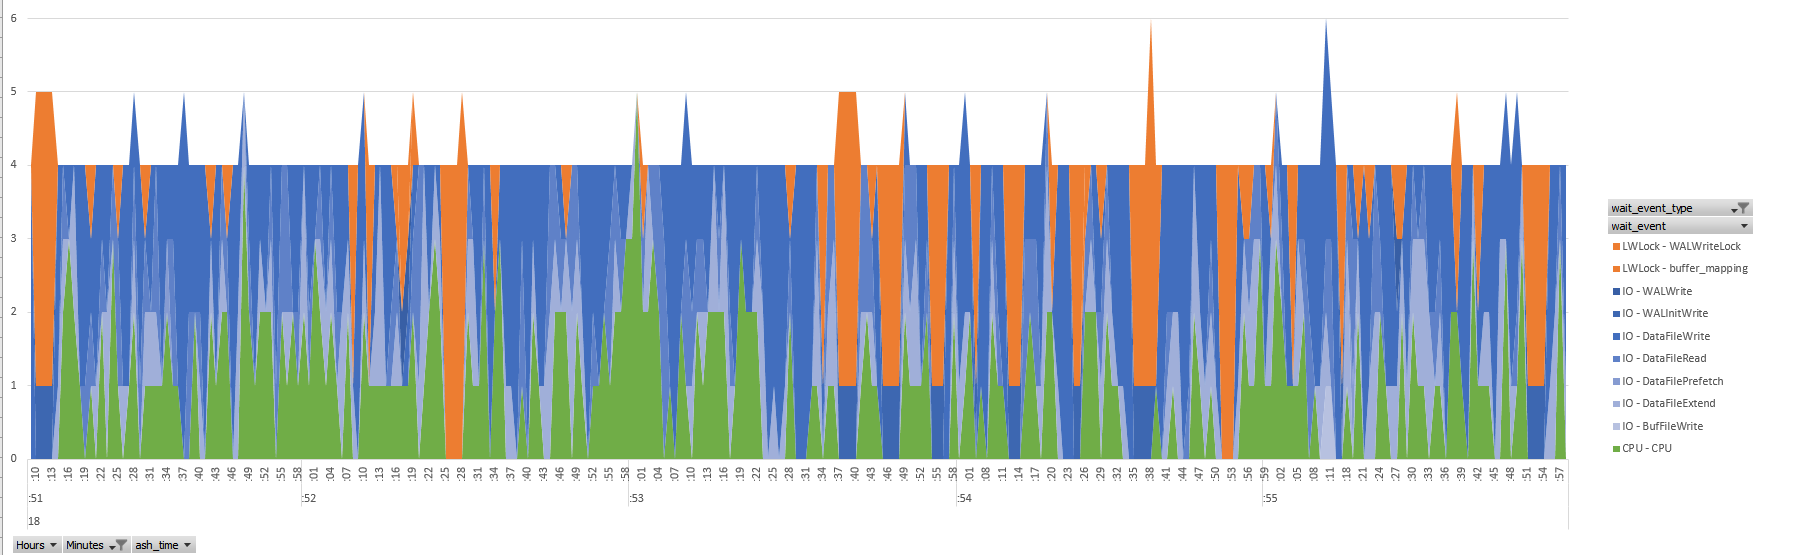
By Franck Pachot . Here is the first test I did with the beta of pgSentinel. This Active Session History sampling is a new approach to Postgres tuning. For people coming from Oracle, this is something that has made our life a lot easier to optimize database applications. Here is a quick example showing how it links together some information… 

PGIO, PG_STAT_ACTIVITY and PG_STAT_STATEMENTS

By Franck Pachot . For an Oracle DBA, we are used to join active sessions (from V$SESSION where status=’ACTIVE) with active statements (from V$SQL where users_executing>0) on the SQL_ID. V$ACTIVE_SESSION_HISTORY also displays the TOP_LEVEL_SQL_ID to get the entrypoint of the usercall if we need it. With Postgres it is a bit more difficult because it seems that PG_STAT_ACTIVITY do not… 

Execution Plan with ASH

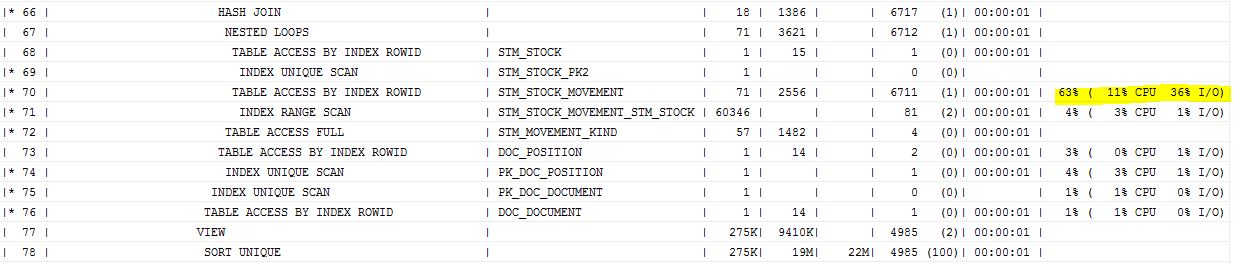
By Franck Pachot . Here is a query I use when I’m on a system that has Diagnostic Pack (ASH) but no tuning Pack (SQL Monitor). It displays the execution plan with dbms_xplan.display_cursor and adds the % of ASH samples in front of each plan operation. Here is a small output example. Usual dbms_xplan output but showing the most active… 

AWR when ASH CPU >> DB CPU

By Franck Pachot . I’ll present How to read an AWR report next month at UKOUG TECH15 and the first recommendation after checking Average Active Sessions is to verify that we are not in a CPU starvation situation. Here is a little demo to show how it looks like in an AWR report. In other words, I’ll demo the second…