

I have written twice about what happens when a table replicated with GoldenGate has no primary key. I covered the common misconceptions about row identification and the risk of migrating tables with no primary key. Both explain why a missing key can be a real risk, but I often get asked what a missing primary key costs. Let’s address these concerns, with different key strategies, multiple metrics for analysis and different variables in the experiment to balance the analysis.
Four key strategies
Every scenario replicates the same table under one of four key strategies:
PK: the table has a primary key.UNIQUE_INDEX: no primary key, but a unique index. GoldenGate selects it automatically as the key.KEYCOLS: no primary key and no unique index, but theKEYCOLSparameter is added to name the columns to use as the key.- No key: scenario where no key can be identified. These are the
bad_columncases ofDBA_GOLDENGATE_NOT_UNIQUE, described in GoldenGate row identification and LOB replication and primary keys. The extract uses every column as a pseudo-key.
Variables changed
The baseline is a table replication with 50 columns, 100,000 rows before replication, and 10,000 transactions with a 33:33:34 insert:update:delete mix. Each comparison changes one variable and keeps the others at baseline. I decided to test four variables:
- Table width: 5, 50 (baseline) and 250 columns, to check which metrics are impacted by the number of columns.
- DML mix: insert-only (100:0:0), update-only (0:100:0), delete-only (0:0:100) and the 33:33:34 baseline, to check which operation type pays the cost of a missing key.
- Transaction volume: 10,000 (baseline) and 100,000 transactions, to check whether the cost scales linearly with the amount of work.
- Table size: 100,000 (baseline) and 1,000,000 rows, to check whether the number of existing rows impacts the replication cost.
Metrics observed
Each test run recorded four metrics:
Questions about your own setup? A dbi services consultant can look at your case.
Talk to an expert (opens in a new tab)- Redo generated: bytes of redo written by the workload session (
redo sizeinV$MYSTAT). DBAs worry about the redo that replication adds to the source. - Redo entries: number of redo entries written by the same session (
redo entries). It shows whether the redo is made of more entries or of larger ones. - Trail bytes: bytes the extract writes to the trail.
- Apply lag: time the replicat needs to apply the whole workload, from its start to the end of the apply.
Of course, other metrics could be gathered and analyzed. I wanted to focus this analysis on the ones I usually get asked about. All tests were run sequentially, to avoid concurrency issues, and randomized, to make sure that no scenario benefits from a warm cache or from a quieter moment on the server. Each scenario and key strategy was run 10 times, for around 40 hours of compute time in total.
Methodology
- Database: Oracle 19c, two CDBs on one host. The source PDB is in
CDB01, the target PDB inCDB02. - GoldenGate: 26ai Microservices. Each run creates a dedicated extract, trail and replicat, then deletes them.
- Workload:
INSERTadds a row,UPDATEchanges one non-key column,DELETEremoves a row. Every operation is committed individually. - Supplemental logging: added with
ADD TRANDATAon every table, through the REST API.PKandUNIQUE_INDEXlog their key columns. - Tables without a key: every column is logged, because primary key supplemental logging falls back to all columns.
KEYCOLS:ADD TRANDATAalso adds a log group onID_COL, but the fallback still applies.KEYCOLSand no key generate the same redo.KEYCOLSonly changes the trail content and how the replicat finds the row.- Repeats: each scenario and key strategy runs 10 times. One pass covers all of them before the next repeat.
- Capture and apply: the replicat starts only once the extract has finished capturing, so capture and apply never overlap and the apply lag measures the apply phase alone.
- Statistics: the graphs display the mean, the standard deviation and the minimum and maximum of the 10 runs of each scenario and key strategy.
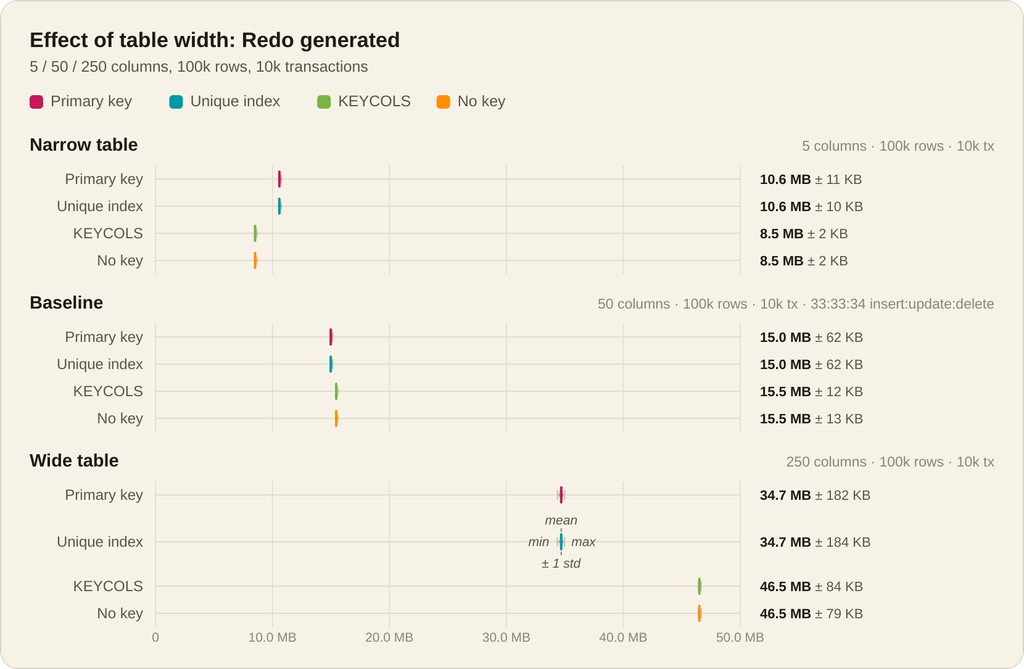
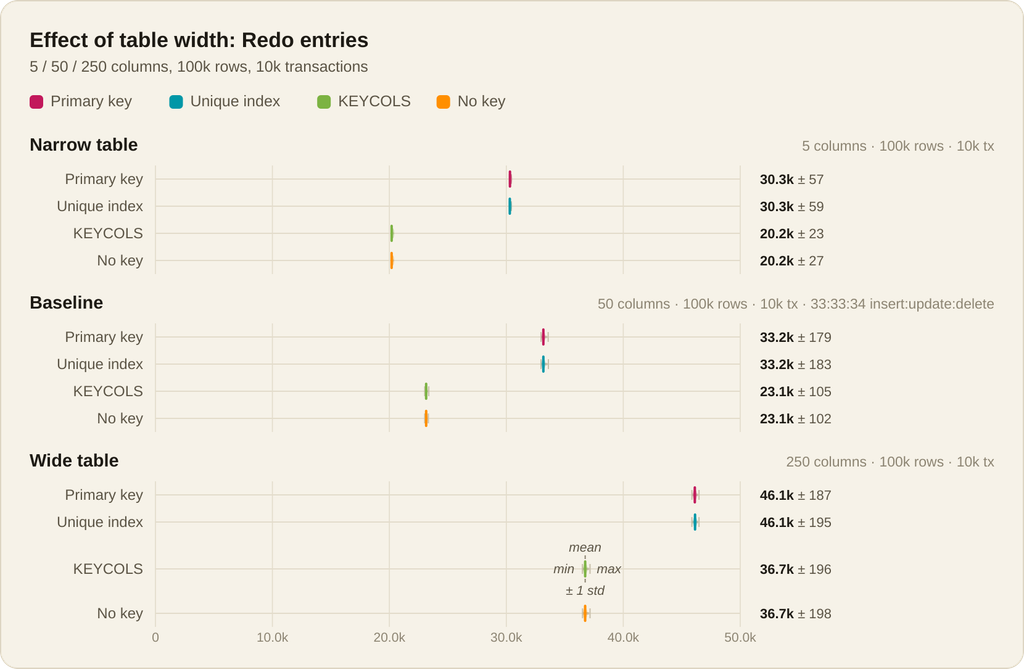
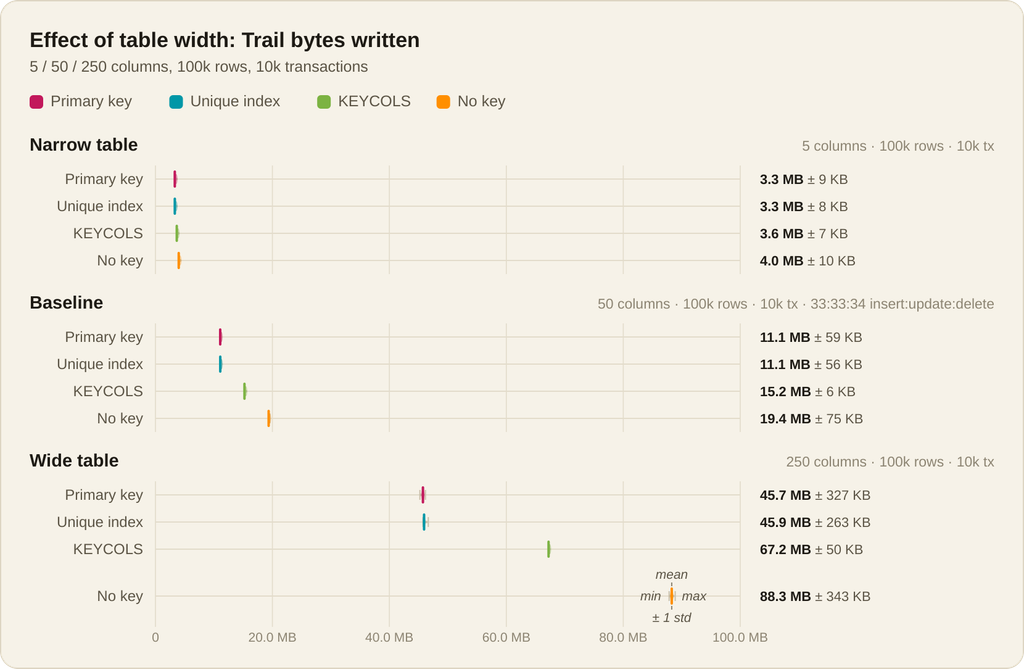
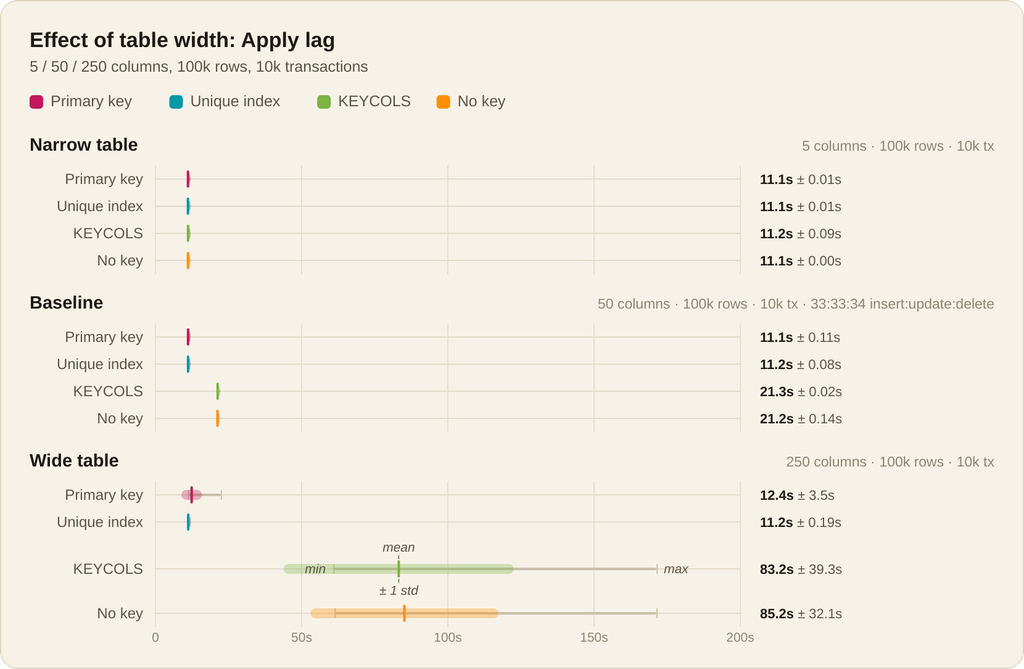
Each chart has one row per key strategy. The box is the mean plus or minus one standard deviation, the whisker runs from the minimum to the maximum and the line is the mean.
Baseline: does key strategy matter?
Here are the metrics for the baseline: a table with 50 columns, 100,000 rows and 10,000 transactions with an equal DML mix.
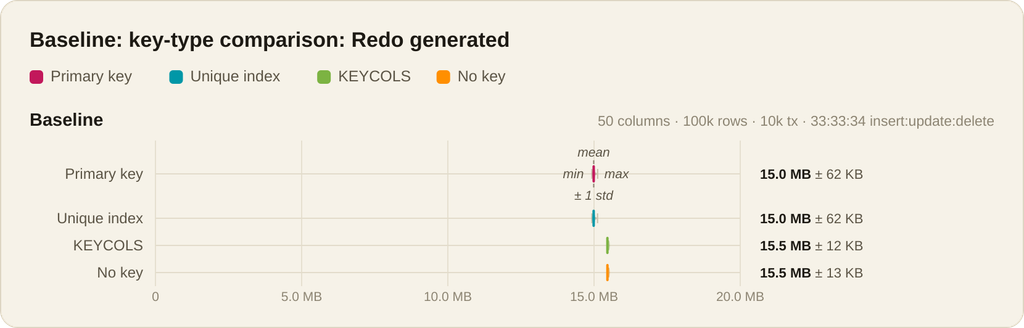
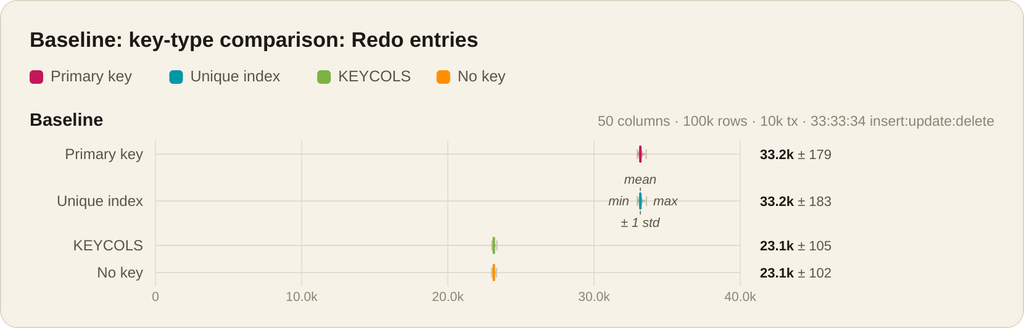
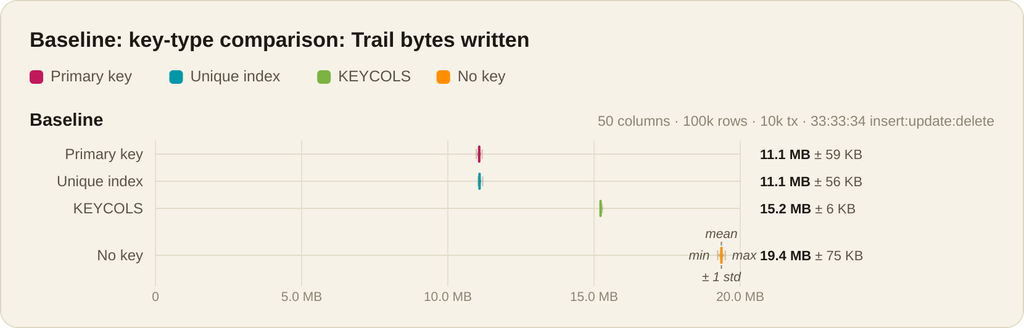
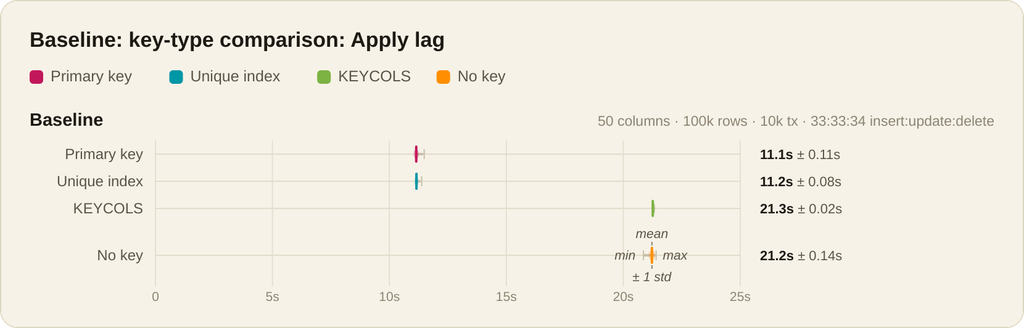
| Key strategy | Redo | Redo entries | Trail | Apply lag |
|---|---|---|---|---|
PK | 15.0 MB | 33.2k | 11.1 MB | 11.1 s |
UNIQUE_INDEX | 15.0 MB | 33.2k | 11.1 MB | 11.2 s |
KEYCOLS | 15.5 MB | 23.1k | 15.2 MB | 21.3 s |
| No key | 15.5 MB | 23.1k | 19.4 MB | 21.2 s |
PKandUNIQUE_INDEXgive the same results on every metric, and so doKEYCOLSand no key, except for the trail volume.- Trail volume is the only metric where
KEYCOLSand no key differ:KEYCOLSreduces it by 21%, but it stays 37% above the scenario where aPKis used. KEYCOLShas no impact on the redo generated, which is the same as no key (see supplemental logging).- With a
PKorUNIQUE_INDEX, apply lag is 47% lower and redo is 3% lower than withKEYCOLSor no key. - A
PKorUNIQUE_INDEXadds 43% more redo entries thanKEYCOLSor no key, because of the index maintenance.
With KEYCOLS or no key, the replicat takes about twice as long to apply the same workload. The trail is 37% larger with KEYCOLS and 75% larger with no key. The redo on the source barely changes.
Does a wider table cost more?
Here is each metric for three different tables: 5, 50 (baseline) and 250 columns.
| Columns | Key strategy | Redo | Redo entries | Trail | Apply lag |
|---|---|---|---|---|---|
| 5 | PK | 10.6 MB | 30.3k | 3.3 MB | 11.1 s |
| 5 | KEYCOLS | 8.5 MB | 20.2k | 3.6 MB | 11.2 s |
| 5 | No key | 8.5 MB | 20.2k | 4.0 MB | 11.1 s |
| 50 | PK | 15.0 MB | 33.2k | 11.1 MB | 11.1 s |
| 50 | KEYCOLS | 15.5 MB | 23.1k | 15.2 MB | 21.3 s |
| 50 | No key | 15.5 MB | 23.1k | 19.4 MB | 21.2 s |
| 250 | PK | 34.7 MB | 46.1k | 45.7 MB | 12.4 s |
| 250 | KEYCOLS | 46.5 MB | 36.7k | 67.2 MB | 83.2 s |
| 250 | No key | 46.5 MB | 36.7k | 88.3 MB | 85.2 s |
A missing key costs more as the table gets wider. At 5 columns it costs nothing on apply lag. At 250 columns the apply lag is about 7 times higher, the trail almost twice as large and the redo 34% higher.
Why the redo gap changes with the table width
When the table width increases, two costs go in opposite directions.
- Index maintenance:
INSERTandDELETEon a keyed table add or remove a B-tree entry. The cost is fixed per operation.UPDATEnever changes the index here. - Full-row logging: a no-key table logs every column on each
UPDATE. The cost grows with the column count.
At 5 columns the fixed index cost dominates and no key generates 20% less redo than PK. At 50 columns no key is 3% above, and at 250 columns it is 34% above.
The entry counts match. PK writes more entries than no key at every width, because of the index: 50% more at 5 columns, 43% at 50 and 26% at 250.
Apply lag at 250 columns is noisy for KEYCOLS and no key (coefficient of variation 38% to 47%). Their medians are about 6 times that of PK.
Which workload type pays for a missing key?
INSERT has no row to identify, so only the index maintenance cost applies. UPDATE and DELETE identify a row.
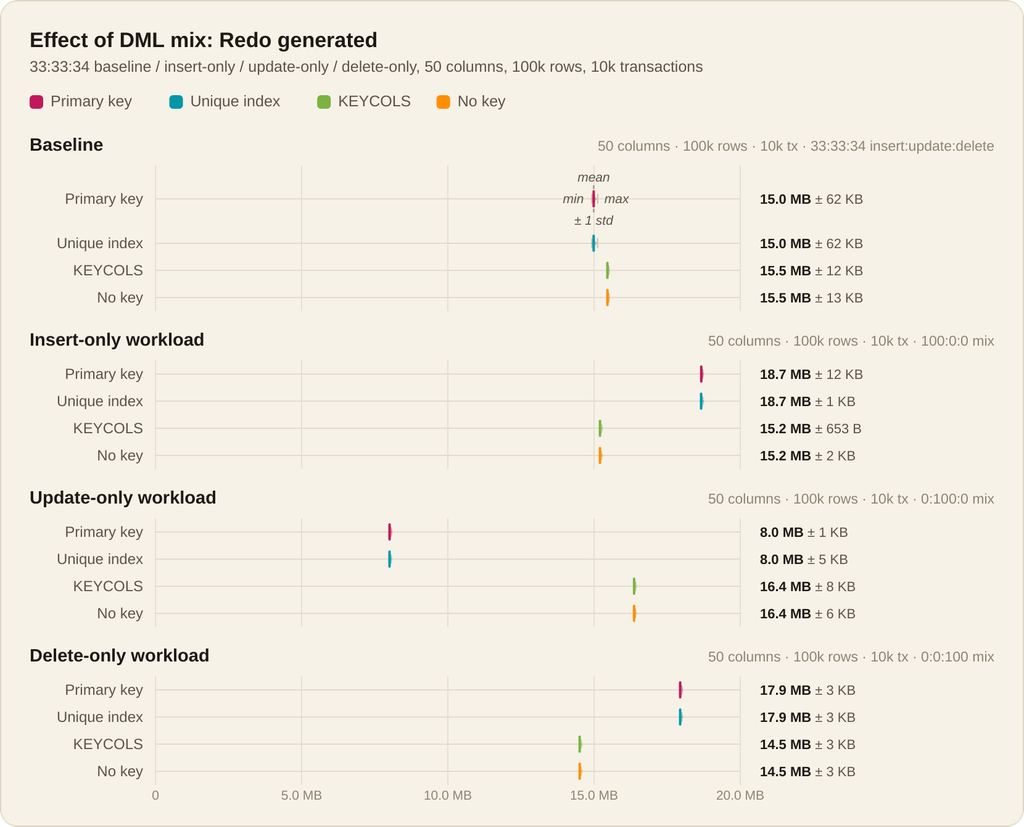
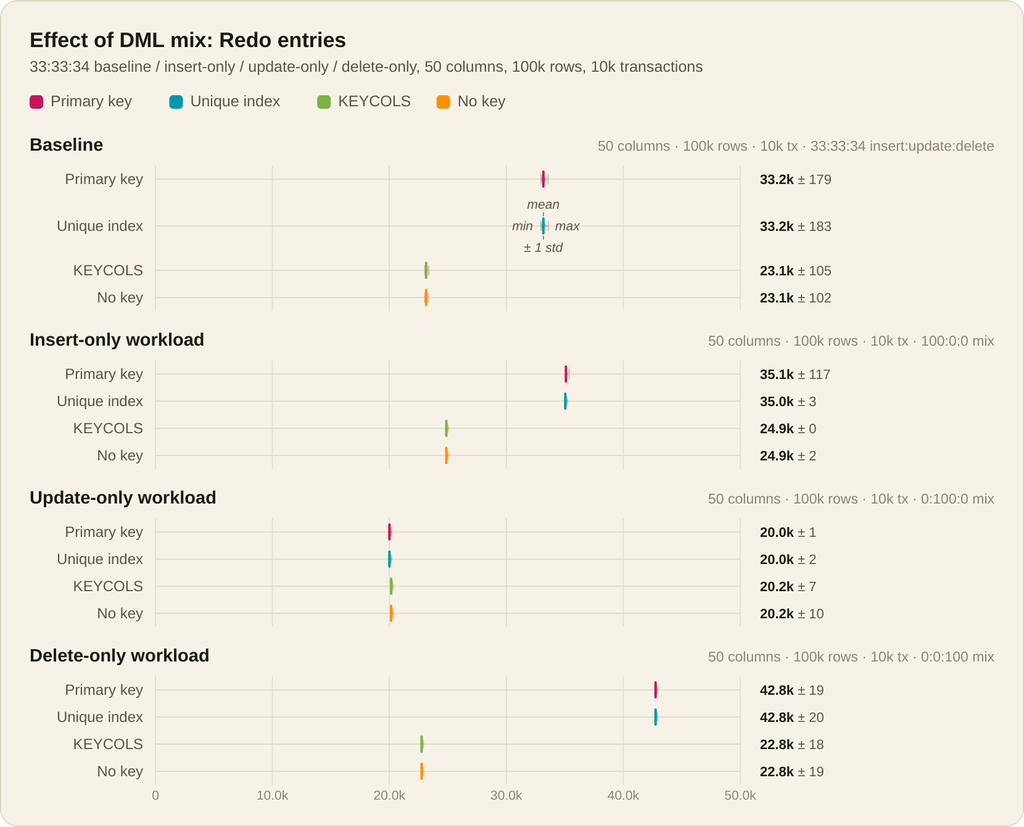
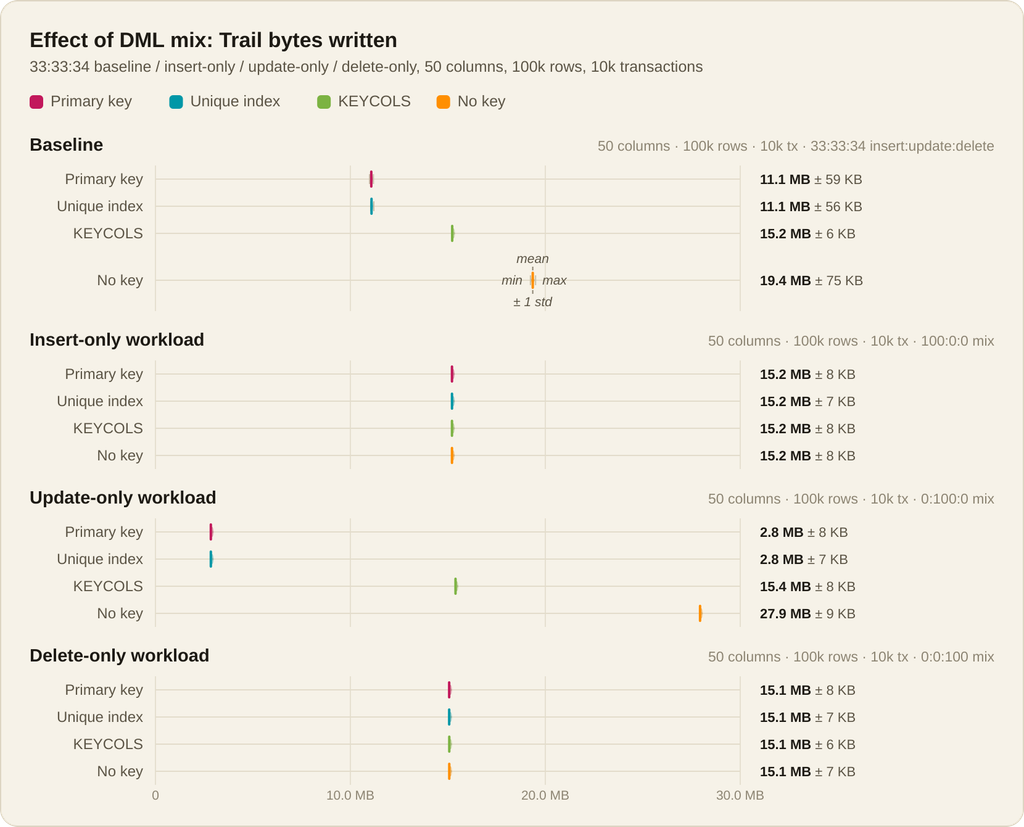
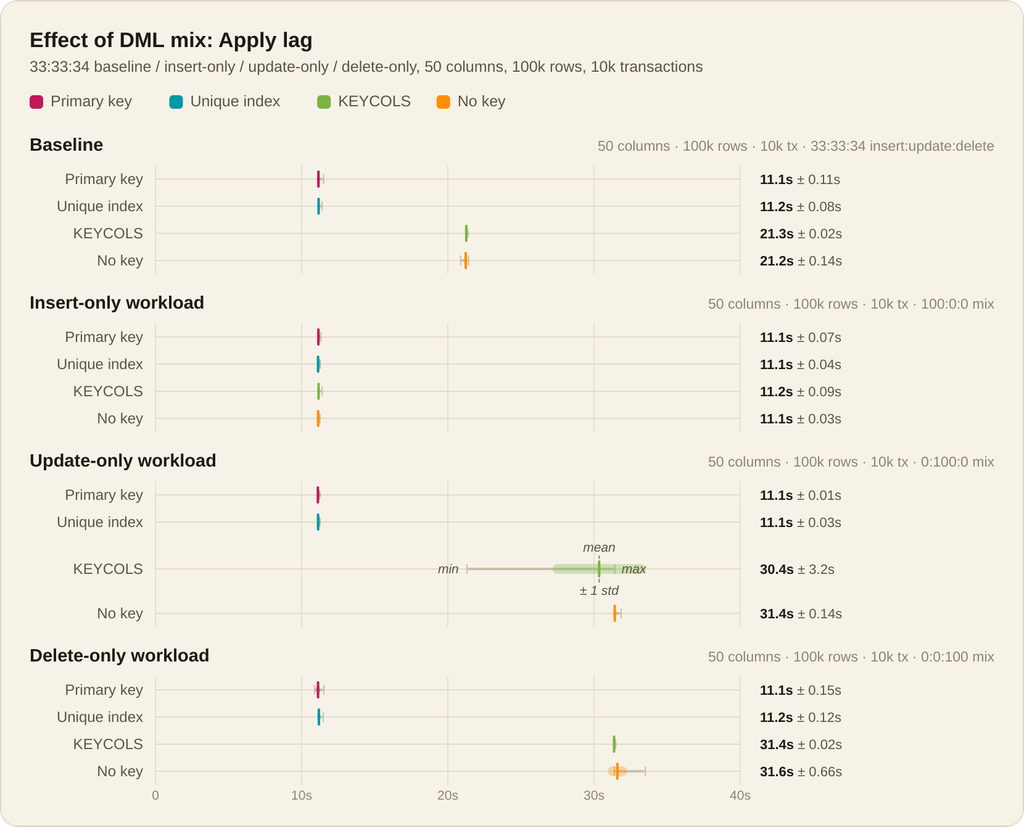
| Workload | Key strategy | Redo | Redo entries | Trail | Apply lag |
|---|---|---|---|---|---|
| Insert-only | PK | 18.7 MB | 35.1k | 15.2 MB | 11.1 s |
| Insert-only | KEYCOLS | 15.2 MB | 24.9k | 15.2 MB | 11.2 s |
| Insert-only | No key | 15.2 MB | 24.9k | 15.2 MB | 11.1 s |
| Update-only | PK | 8.0 MB | 20.0k | 2.8 MB | 11.1 s |
| Update-only | KEYCOLS | 16.4 MB | 20.2k | 15.4 MB | 30.4 s |
| Update-only | No key | 16.4 MB | 20.2k | 27.9 MB | 31.4 s |
| Delete-only | PK | 17.9 MB | 42.8k | 15.1 MB | 11.1 s |
| Delete-only | KEYCOLS | 14.5 MB | 22.8k | 15.1 MB | 31.4 s |
| Delete-only | No key | 14.5 MB | 22.8k | 15.1 MB | 31.6 s |
- Insert-only: a key costs 23% more redo, from the index entries. Trail bytes and apply lag are identical.
- Delete-only: a key costs 24% more redo, for the same reason. Apply lag is almost 3 times higher without a key.
- Update-only: no key generates twice the redo of a key. Trail bytes are 5.5 times larger with
KEYCOLSand 10 times larger with no key than withPK.
INSERT pays nothing: apply lag and trail are the same with or without a key. DELETE makes the apply almost 3 times slower, and UPDATE is the worst case, with a trail 5.5 to 10 times larger and twice the redo. The cost of a missing key falls entirely on the statements that have to find an existing row.
Does the cost scale with the workload?
Each transaction is independent. Every metric should scale by 10x from 10,000 to 100,000 transactions.
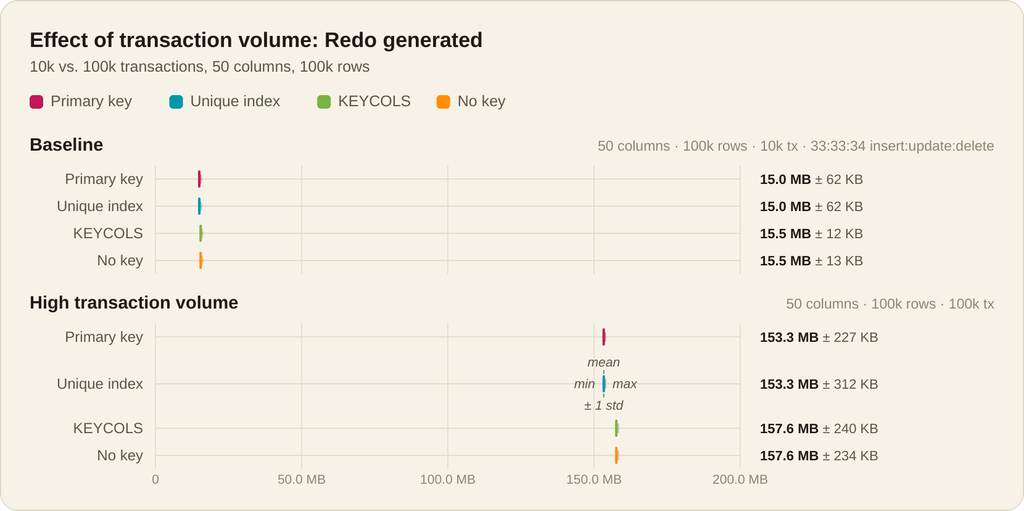
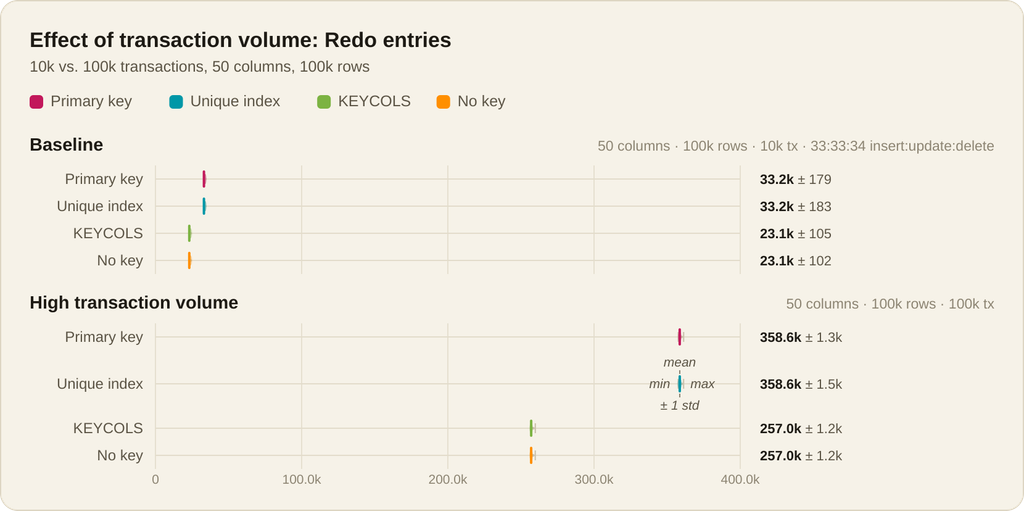
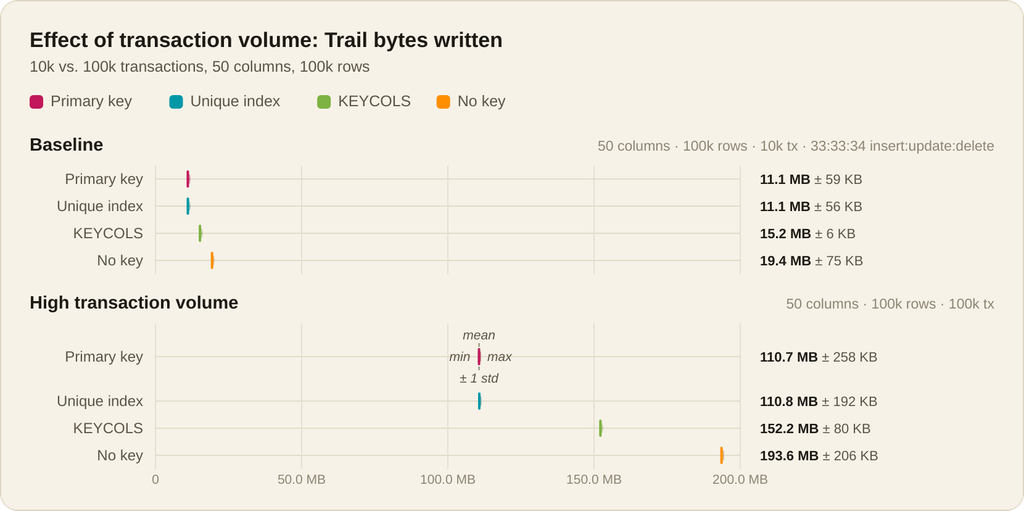
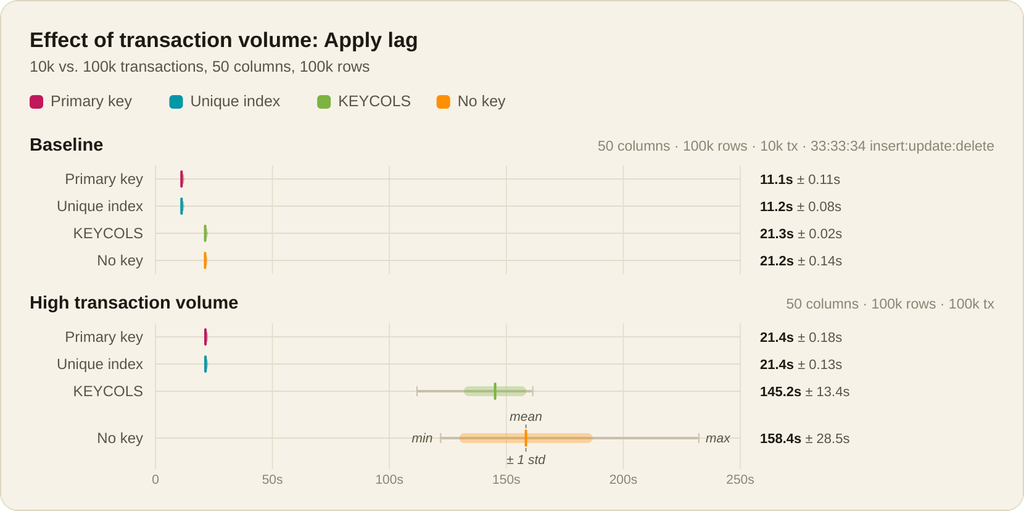
| Key strategy | Redo | Trail | Apply lag |
|---|---|---|---|
PK | 10.23x | 9.99x | 1.9x |
UNIQUE_INDEX | 10.23x | 9.99x | 1.9x |
KEYCOLS | 10.20x | 10.00x | 6.8x |
| No key | 10.20x | 10.00x | 7.5x |
- Redo and trail bytes scale linearly for every key strategy.
- Apply lag grows 7x for
KEYCOLS, 7.5x for no key and 2x forPK.
The gap grows faster than the volume: with 10 times more transactions, apply lag only doubles with a key but is multiplied by 7 without one, so a missing key goes from about 2 times slower to about 7 times slower.
Does the number of rows change the cost?
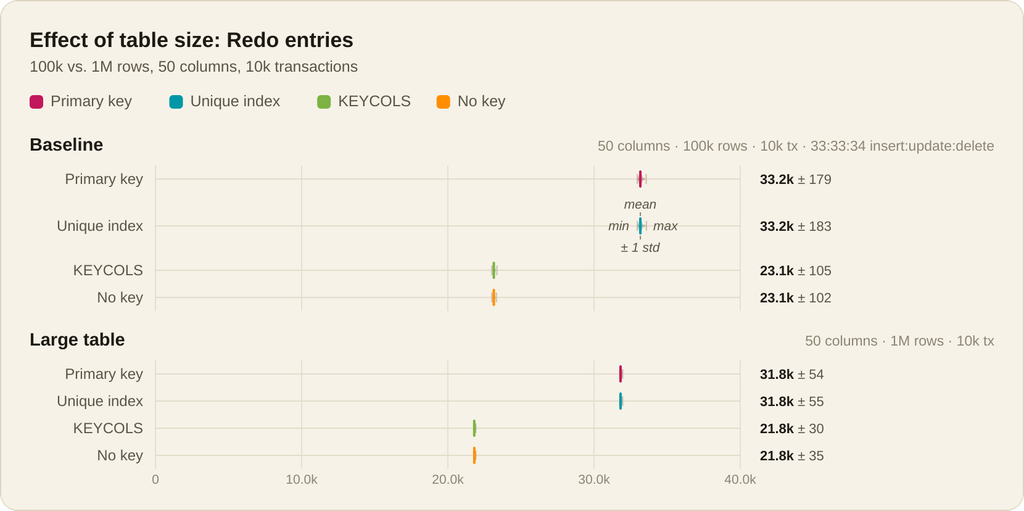
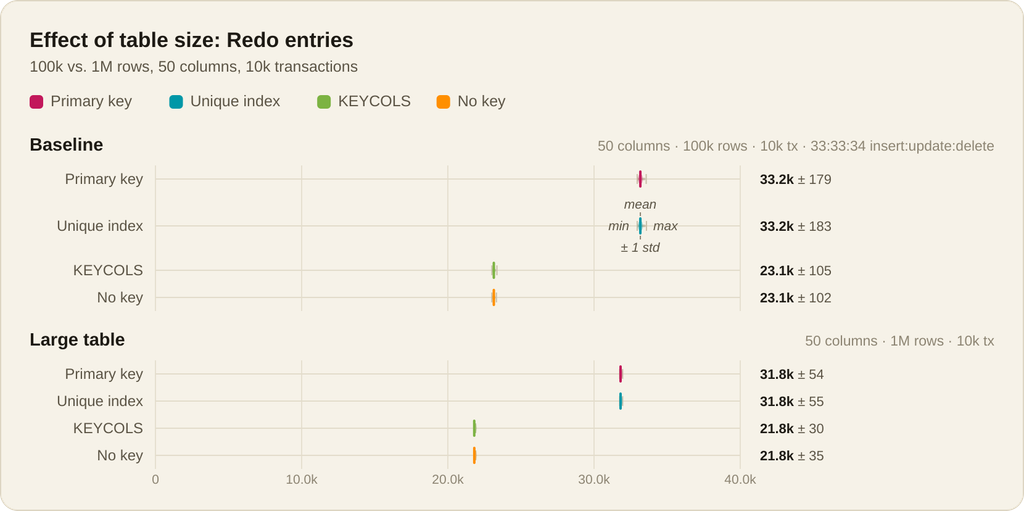
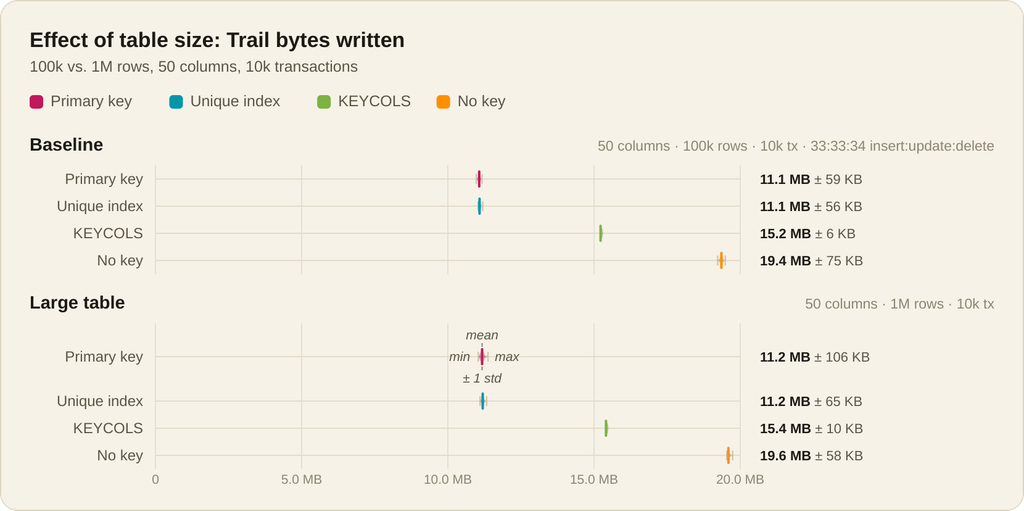
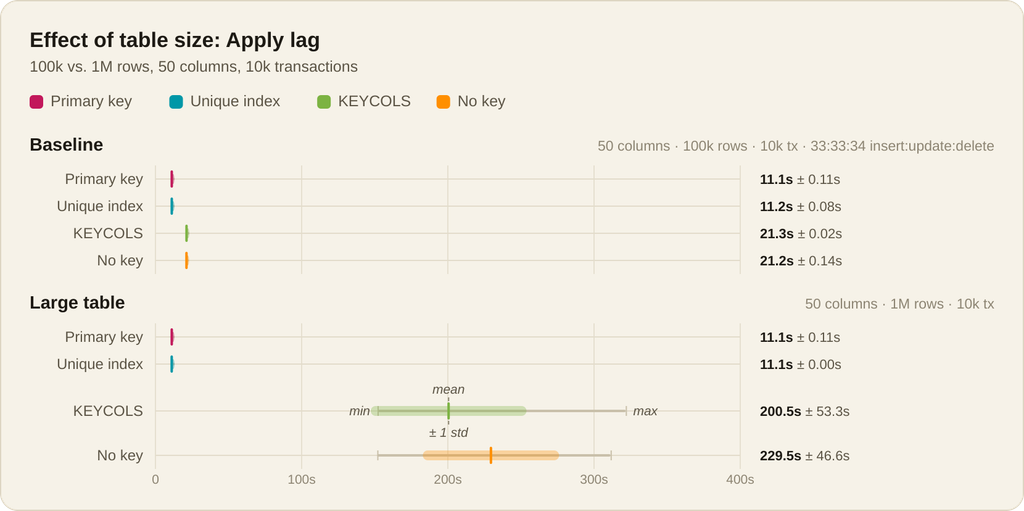
Each run changes a fixed number of rows. The table size should not change redo, trail bytes or apply lag.
| Key strategy | Redo, 100k to 1M rows | Trail, 100k to 1M rows | Apply lag, 100k to 1M rows |
|---|---|---|---|
PK | 15.0 to 14.9 MB | 11.1 to 11.2 MB | 11.1 to 11.1 s |
UNIQUE_INDEX | 15.0 to 14.9 MB | 11.1 to 11.2 MB | 11.2 to 11.1 s |
KEYCOLS | 15.5 to 15.5 MB | 15.2 to 15.4 MB | 21.3 to 200.5 s |
| No key | 15.5 to 15.5 MB | 19.4 to 19.6 MB | 21.2 to 229.5 s |
PKandUNIQUE_INDEXare unchanged, as expected.- Redo does not change with table size for any key strategy.
- Apply lag is 9 times higher for
KEYCOLSand 11 times higher for no key. The likely cause is that their target tables have no index on the key columns and are 10 times larger.
With a key, table size does not matter. Without one, a table 10 times larger makes the apply 9 times slower with KEYCOLS and 11 times slower with no key, because the replicat has to search the table for every row it changes.
Conclusion
- As expected,
PKandUNIQUE_INDEXare the same for GoldenGate: redo, trail and apply lag are the same in every scenario tested. A unique index is as good as a primary key. - No key costs apply lag and trail volume:
- Compared with a
PK, the apply is about twice as slow at baseline and the trail is 75% larger. - The gap grows with table width, workload volume and table size: the apply is up to 20 times slower, and the trail is 10 times larger on an update-only workload.
- It comes entirely from
UPDATEandDELETE:INSERTcosts nothing on apply lag. - Redo stays within a few percent at baseline. It is 34% higher at 250 columns, but 20% lower on narrow tables and insert-only workloads, because there is no index to maintain.
- Compared with a
KEYCOLSis not a workaround for a missing key:- Compared with a
PK, the apply is about twice as slow at baseline and the trail is 37% larger. - Compared with no key, the only gain is a smaller trail (21% at baseline). Redo and apply lag do not improve.
- Compared with a