

Recently, I was working on deploying Metric Extensions automatically in Enterprise Manager, but the more I looked into it, the more it turned into a different question: what does a Metric Extension look like ? In a previous blog, I presented the SYSMAN tables containing the metric extensions definitions. I also showed how to retrieve the targets where a metric extension is deployed. Now, it’s time to look at formatting metric extensions.
Once again, emcli help does not show any verb for creating metric extensions:
$ emcli help | grep -i metric_extension
    export_metric_extension           -- Export a metric extension to an archive file
    get_unused_metric_extensions      -- Get a list of unused metric extensions
    import_metric_extension           -- Import a metric extension archive file
    publish_metric_extension          -- Publish a metric extension for use by all administrators
    save_metric_extension_draft       -- Save a deployable draft of a metric extension
Unfortunately, nothing in the documentation will help us to create a metric extension outside of the web UI. So let’s reverse engineer them. The plan is the following:
- Create metric extensions in the web UI
- Export the XML files with
emcli - Later, create new metric extensions or update existing metrics more easily, directly with
emcli
Building a minimal metric extension
Let’s build the most basic metric extension first, with Host as the target type. I will choose the OS Command - Multiple Columns adapter, and just an echo command.
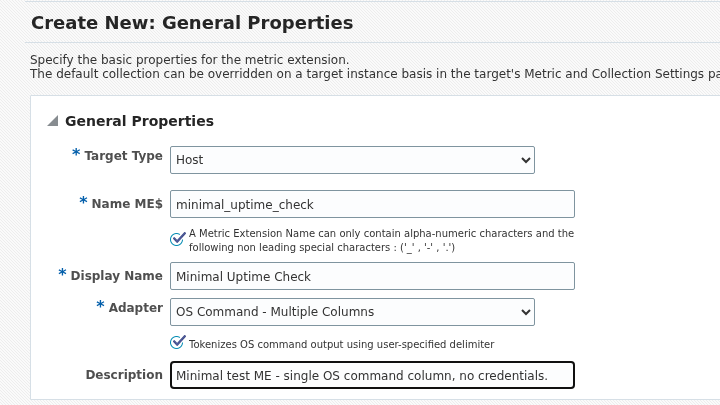
The adapter itself is /bin/echo with em_result=1 as its argument and em_result= as the Starts With prefix. It is the same em_result=-prefixed, delimiter-tokenized convention the OEM plugin’s OSLineToken fetchlet uses, which turned out not to be a coincidence (more on that below). One column, value, type Number:
Questions about your own setup? A dbi services consultant can look at your case.
Talk to an expert (opens in a new tab)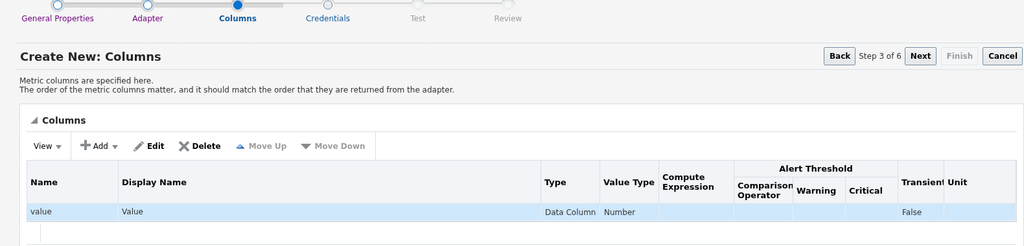
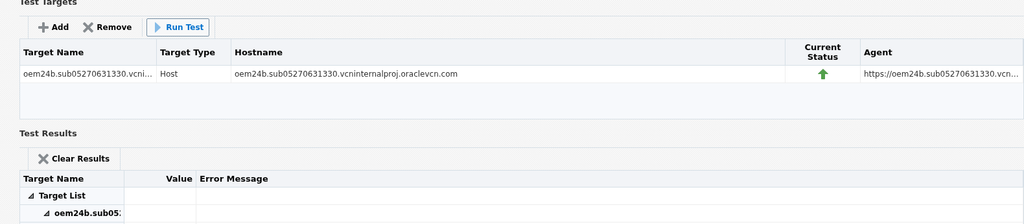
The Test step lets you run the metric job for real against a live target before committing to anything. Since the idea is to have a valid archive that we can play with, it should definitely be tested.
Exporting the metric extension
You cannot export an Editable metric. The docs restrict export_metric_extension to Production, Deployable Draft, and Published versions. So the first step is promoting it, either via the UI or with emcli:
$ emcli save_metric_extension_draft -target_type=host -name='ME$minimal_uptime_check' -version=1Don’t worry if you receive no output, this is expected. Then, you can export the metric:
$ emcli export_metric_extension -file_name=/tmp/minimal_uptime_check_v1.zip -target_type=host -name='ME$minimal_uptime_check' -version=1
Metric extension [host, ME$minimal_uptime_check, 1] exported successfully to file /tmp/minimal_uptime_check_v1.zip
There are three files in the archive:
metadata/ME#24#minimal_uptime_check.xml
collection/ME#24#minimal_uptime_check.xml
mea.xml
The first one is the manifest, mea.xml:
<MetricExtensionArchive name="MEAME$minimal_uptime_check">
<MetricExtension name="ME$minimal_uptime_check" type="host" version="1" is_repos="FALSE" display_name="Minimal Uptime Check" description="Minimal test ME - single OS command column, no credentials." version_comment=" " metadata_digest="18147044f9d9fab88c8ebbee213d2e1e" coll_digest="e1a287a6df820c5e7d7fda0bd0bfcb3f" attach_digest="d41d8cd98f00b204e9800998ecf8427e">
</MetricExtension>
</MetricExtensionArchive>
The metric definition is in metadata/ME#24#minimal_uptime_check.xml:
<TargetMetadataExt EXT_NAME="ME$minimal_uptime_check" EXT_VERSION="1" TARGET_TYPE="host"><Metric NAME="ME$minimal_uptime_check" TYPE="TABLE">
<Display>
<Label NLSID="NLS_METRIC_hostME$minimal_uptime_check">Minimal Uptime Check</Label>
<Description NLSID="NLS_DESCRIPTION_hostME$minimal_uptime_check">Minimal test ME - single OS command column, no credentials.</Description>
</Display>
<TableDescriptor>
<ColumnDescriptor NAME="value" TYPE="NUMBER">
<Display>
<Label NLSID="NLS_COLUMN_hostME$minimal_uptime_checkvalue">Value</Label>
</Display>
</ColumnDescriptor>
</TableDescriptor>
<QueryDescriptor FETCHLET_ID="OSLineToken">
<Property NAME="command" SCOPE="GLOBAL">/bin/echo</Property>
<Property NAME="scriptLoc" SCOPE="GLOBAL" OPTIONAL="TRUE">%scriptsDir%</Property>
<Property NAME="args" SCOPE="GLOBAL" OPTIONAL="TRUE">em_result=1</Property>
<Property NAME="delimiter" SCOPE="GLOBAL" OPTIONAL="TRUE">|</Property>
<Property NAME="startsWith" SCOPE="GLOBAL" OPTIONAL="TRUE">em_result=</Property>
<Property NAME="ENVEM_TARGET_NAME" SCOPE="INSTANCE" OPTIONAL="TRUE">NAME</Property>
<CredentialRef NAME="OSCreds"></CredentialRef>
</QueryDescriptor>
</Metric>
</TargetMetadataExt>
Here, we can see that:
FETCHLET_ID="OSLineToken"is the same fetchlet a full OEM plugin’sTargetMetadataXML uses for itsOSLineToken-based collectors. The wizard is just generating the same fetchlet configuration.command,args,delimiterandstartsWithare the basic properties fields the adapter step.ENVEM_TARGET_NAMEis set even though I did not alter the Environment Variables section. This is the default.
The last file, collection/ME#24#minimal_uptime_check.xml, is the schedule:
<TargetCollectionExt EXT_NAME="ME$minimal_uptime_check" EXT_VERSION="1" TARGET_TYPE="host"><CollectionItem NAME="ME$minimal_uptime_check" UPLOAD="YES">
	<Schedule>
		<IntervalSchedule INTERVAL="15" TIME_UNIT="Min"/>
	</Schedule>
	<MetricColl NAME="ME$minimal_uptime_check">
	</MetricColl>
</CollectionItem>
</TargetCollectionExt>
Adding a second column and a real environment variable
Let’s build a second metric extension from the UI with the same command, but with two columns instead of one. I will also add a custom environment variable this time.
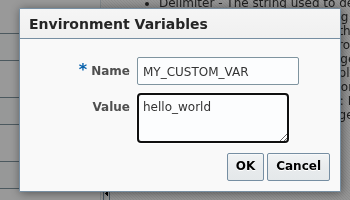
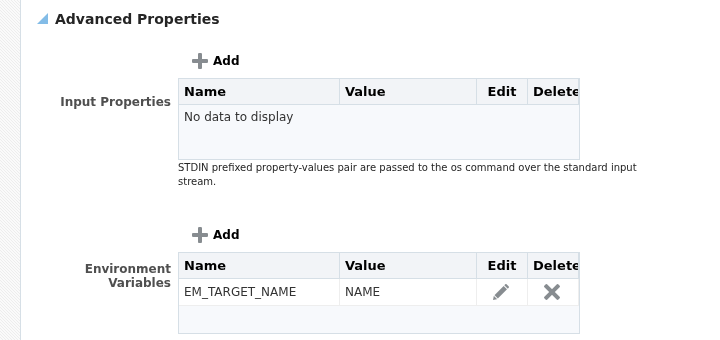
For comparison, this is what the Environment Variables table looks like before you add anything to it: EM_TARGET_NAME is already there.
And the second column added on the Columns step:
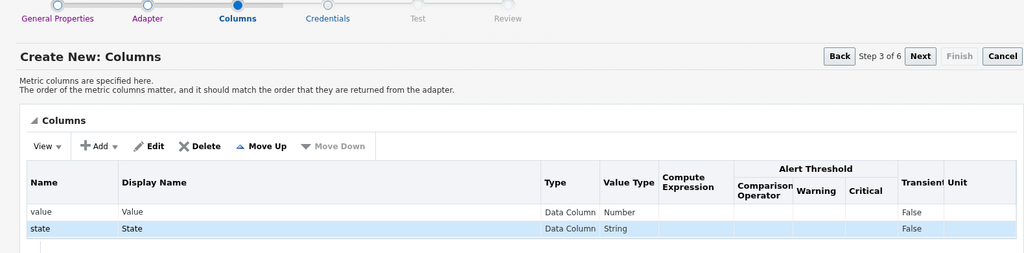
Exporting this metric extension and comparing the metadata against the first archive shows exactly what each choice changes:
$ diff unpacked/metadata/*.xml unpacked_v2/metadata/*.xml
1c1
< <TargetMetadataExt EXT_NAME="ME$minimal_uptime_check" EXT_VERSION="1" TARGET_TYPE="host"><Metric NAME="ME$minimal_uptime_check" TYPE="TABLE">
---
> <TargetMetadataExt EXT_NAME="ME$minimal_uptime_check_v2" EXT_VERSION="1" TARGET_TYPE="host"><Metric NAME="ME$minimal_uptime_check_v2" TYPE="TABLE">
3,4c3,4
< <Label NLSID="NLS_METRIC_hostME$minimal_uptime_check">Minimal Uptime Check</Label>
< <Description NLSID="NLS_DESCRIPTION_hostME$minimal_uptime_check">Minimal test ME - single OS command column, no credentials.</Description>
---
> <Label NLSID="NLS_METRIC_hostME$minimal_uptime_check_v2">Minimal Uptime Check V2</Label>
> <Description NLSID="NLS_DESCRIPTION_hostME$minimal_uptime_check_v2">Variant with env var and 2 columns, for archive-format comparison.</Description>
9c9,14
< <Label NLSID="NLS_COLUMN_hostME$minimal_uptime_checkvalue">Value</Label>
---
> <Label NLSID="NLS_COLUMN_hostME$minimal_uptime_check_v2value">Value</Label>
> </Display>
> </ColumnDescriptor>
> <ColumnDescriptor NAME="state" TYPE="STRING">
> <Display>
> <Label NLSID="NLS_COLUMN_hostME$minimal_uptime_check_v2state">State</Label>
16c21
< <Property NAME="args" SCOPE="GLOBAL" OPTIONAL="TRUE">em_result=1</Property>
---
> <Property NAME="args" SCOPE="GLOBAL" OPTIONAL="TRUE">em_result=1|running</Property>
19a25
> <Property NAME="ENVMY_CUSTOM_VAR" SCOPE="INSTANCE" OPTIONAL="TRUE">hello_world</Property>
The second extension was saved under a new name, ME$minimal_uptime_check_v2, so every EXT_NAME, NAME and NLSID differs. Removing this noise, there are three changes that matter: the new state column, the args property, and the environment variable ENVMY_CUSTOM_VAR.
...
> <ColumnDescriptor NAME="state" TYPE="STRING">
> <Display>
> <Label NLSID="NLS_COLUMN_hostME$minimal_uptime_checkstate">State</Label>
> </Display>
> </ColumnDescriptor>

...

< <Property NAME="args" SCOPE="GLOBAL" OPTIONAL="TRUE">em_result=1</Property>
---
> <Property NAME="args" SCOPE="GLOBAL" OPTIONAL="TRUE">em_result=1|running</Property>

...

> <Property NAME="ENVMY_CUSTOM_VAR" SCOPE="INSTANCE" OPTIONAL="TRUE">hello_world</Property>
The new column is a second ColumnDescriptor, in the same order as the pipe-delimited output (em_result=1|running). The environment variable becomes ENVMY_CUSTOM_VAR=hello_world.
Adding an uploaded script
Both examples above run an OS command directly. Let’s create a metric extension that runs an uploaded script instead of a literal command. Exporting a metric extension with an uploaded Perl script adds a fourth path to the archive, alongside the usual mea.xml/metadata/collection:
mea.xml
metadata/ME#24#script_uptime_check.xml
collection/ME#24#script_uptime_check.xml
scripts/uptime_check.pl
The manifest lists the script by its real name, in a <scripts> element, with an updated attach_digest parameter.
<MetricExtensionArchive name="MEAME$script_uptime_check">
<MetricExtension name="ME$script_uptime_check" type="host" version="1" is_repos="FALSE" display_name="Script Uptime Check" description="ME cloned from minimal_uptime_check, adapter modified to run an uploaded script." version_comment=" " metadata_digest="e4778d5b4a756fed3d7e73aa55931d88" coll_digest="bc223105d5b2e6e31d5123eadcbd929b" attach_digest="d04278db542142ccb9a89be64c3e151e">
<scripts name="uptime_check.pl">
</scripts>
</MetricExtension>
</MetricExtensionArchive>
The QueryDescriptor has a new property called script, giving the script name. The command property is also updated, pointing at perl instead of /bin/echo.
<QueryDescriptor FETCHLET_ID="OSLineToken">
<Property NAME="command" SCOPE="GLOBAL">%perlBin%/perl</Property>
<Property NAME="script" SCOPE="GLOBAL" OPTIONAL="TRUE">%scriptsDir%/uptime_check.pl</Property>
<Property NAME="scriptLoc" SCOPE="GLOBAL" OPTIONAL="TRUE">%scriptsDir%</Property>
<Property NAME="delimiter" SCOPE="GLOBAL" OPTIONAL="TRUE">|</Property>
<Property NAME="startsWith" SCOPE="GLOBAL" OPTIONAL="TRUE">em_result=</Property>
<Property NAME="ENVEM_TARGET_NAME" SCOPE="INSTANCE" OPTIONAL="TRUE">NAME</Property>
<CredentialRef NAME="OSCreds"></CredentialRef>
</QueryDescriptor>
Repository-side metric extension
Let’s conclude by creating a repository-side metric extension, which runs SQL against the OMS repository. With a repository-side Metric Extension, the FETCHLET_ID is REPOSITORY_SQL, and the properties are replaced by a Source property containing the SQL query:
<QueryDescriptor FETCHLET_ID="REPOSITORY_SQL">
<Property NAME="Type" SCOPE="GLOBAL">SQL</Property>
<Property NAME="Source" SCOPE="GLOBAL">SELECT target_guid,
       target_type,
       1 AS host_count
FROM mgmt$target
WHERE target_type = 'host'</Property>
</QueryDescriptor>
In the manifest, is_repos="TRUE" is what differentiates this kind of metric extension. The <Metric> element itself picks up REPOSITORY="TRUE" too, and the columns default to the query SELECT list (TARGET_TYPE, HOST_COUNT here) rather than anything typed by hand on the Columns step.
<MetricExtensionArchive name="MEAME$sql_target_count">
<MetricExtension name="ME$sql_target_count" type="host" version="1" is_repos="TRUE" display_name="SQL Target Count" description="Test ME using the repository-side SQL adapter: counts targets by status." version_comment=" " metadata_digest="0ca6af88e017fb535ae2d59f7f1b6143" coll_digest="e7be6de5a24037de10846bc29391bf2f" attach_digest="d41d8cd98f00b204e9800998ecf8427e">
</MetricExtension>
</MetricExtensionArchive>
With all of this in mind, let’s try to feed the Enterprise Manager a custom metric extension built entirely by hand, using a small Python script as the collector instead of a literal command.
Import our first custom metric extension
Here is a script reading the 1-minute load average from /proc/loadavg and printing it with the same em_result= prefix expected by OSLineToken.
#!/usr/bin/env python3
with open("/proc/loadavg") as f:
    load1 = f.read().split()[0]
print(f"em_result={load1}")
We have three XML files and the script, written by hand rather than exported from the wizard. metadata/ME#24#python_load_check.xml:
<TargetMetadataExt EXT_NAME="ME$python_load_check" EXT_VERSION="1" TARGET_TYPE="host"><Metric NAME="ME$python_load_check" TYPE="TABLE">
<Display>
<Label NLSID="NLS_METRIC_hostME$python_load_check">Python Load Check</Label>
<Description NLSID="NLS_DESCRIPTION_hostME$python_load_check">Runs an uploaded Python script that reads the 1-minute load average from /proc/loadavg.</Description>
</Display>
<TableDescriptor>
<ColumnDescriptor NAME="value" TYPE="NUMBER">
<Display>
<Label NLSID="NLS_COLUMN_hostME$python_load_checkvalue">Value</Label>
</Display>
</ColumnDescriptor>
</TableDescriptor>
<QueryDescriptor FETCHLET_ID="OSLineToken">
<Property NAME="command" SCOPE="GLOBAL">/usr/bin/python3</Property>
<Property NAME="script" SCOPE="GLOBAL" OPTIONAL="TRUE">%scriptsDir%/load_check.py</Property>
<Property NAME="scriptLoc" SCOPE="GLOBAL" OPTIONAL="TRUE">%scriptsDir%</Property>
<Property NAME="delimiter" SCOPE="GLOBAL" OPTIONAL="TRUE">|</Property>
<Property NAME="startsWith" SCOPE="GLOBAL" OPTIONAL="TRUE">em_result=</Property>
<Property NAME="ENVEM_TARGET_NAME" SCOPE="INSTANCE" OPTIONAL="TRUE">NAME</Property>
<CredentialRef NAME="OSCreds"></CredentialRef>
</QueryDescriptor>
</Metric>
</TargetMetadataExt>
The command property points at the interpreter (/usr/bin/python3 instead of %perlBin%/perl), while script points at the uploaded file. Everything else is untouched. Here is the collection/ME#24#python_load_check.xml file:
<TargetCollectionExt EXT_NAME="ME$python_load_check" EXT_VERSION="1" TARGET_TYPE="host"><CollectionItem NAME="ME$python_load_check" UPLOAD="YES">
	<Schedule>
		<IntervalSchedule INTERVAL="15" TIME_UNIT="Min"/>
	</Schedule>
	<MetricColl NAME="ME$python_load_check">
	</MetricColl>
</CollectionItem>
</TargetCollectionExt>
And the manifest mea.xml:
<MetricExtensionArchive name="MEAME$python_load_check">
<MetricExtension name="ME$python_load_check" type="host" version="1" is_repos="FALSE" display_name="Python Load Check" description="Runs an uploaded Python script that reads the 1-minute load average from /proc/loadavg." version_comment=" " metadata_digest="0000000000000000000000000000000" coll_digest="0000000000000000000000000000000" attach_digest="0000000000000000000000000000000">
<scripts name="load_check.py">
</scripts>
</MetricExtension>
</MetricExtensionArchive>
The digests are just zeroes here. The OMS recomputes and stores new digests when you import the metric.
Now, let’s build the archive with the same layout export_metric_extension produces, assembled by hand instead:
$ find build -type f
build/mea.xml
build/metadata/ME#24#python_load_check.xml
build/collection/ME#24#python_load_check.xml
build/scripts/load_check.py

$ cd build && zip -rq ../python_load_check.zip . && cd ..
$ unzip -l python_load_check.zip
Archive:  python_load_check.zip
  Length      Date    Time    Name
---------  ---------- -----   ----
        0  08-27-2026 14:38   metadata/
     1212  08-27-2026 14:38   metadata/ME#24#python_load_check.xml
        0  08-27-2026 14:38   collection/
      321  08-27-2026 14:38   collection/ME#24#python_load_check.xml
        0  08-27-2026 14:38   scripts/
      116  08-27-2026 14:38   scripts/load_check.py
      529  08-27-2026 14:38   mea.xml
---------                     -------
     2178                     7 files
The last step is to import the metric extension with emcli:
$ emcli import_metric_extension -file_name=python_load_check.zip
Metric extension file python_load_check.zip imported successfully
You now know how to build metric extensions without going through the web UI.