

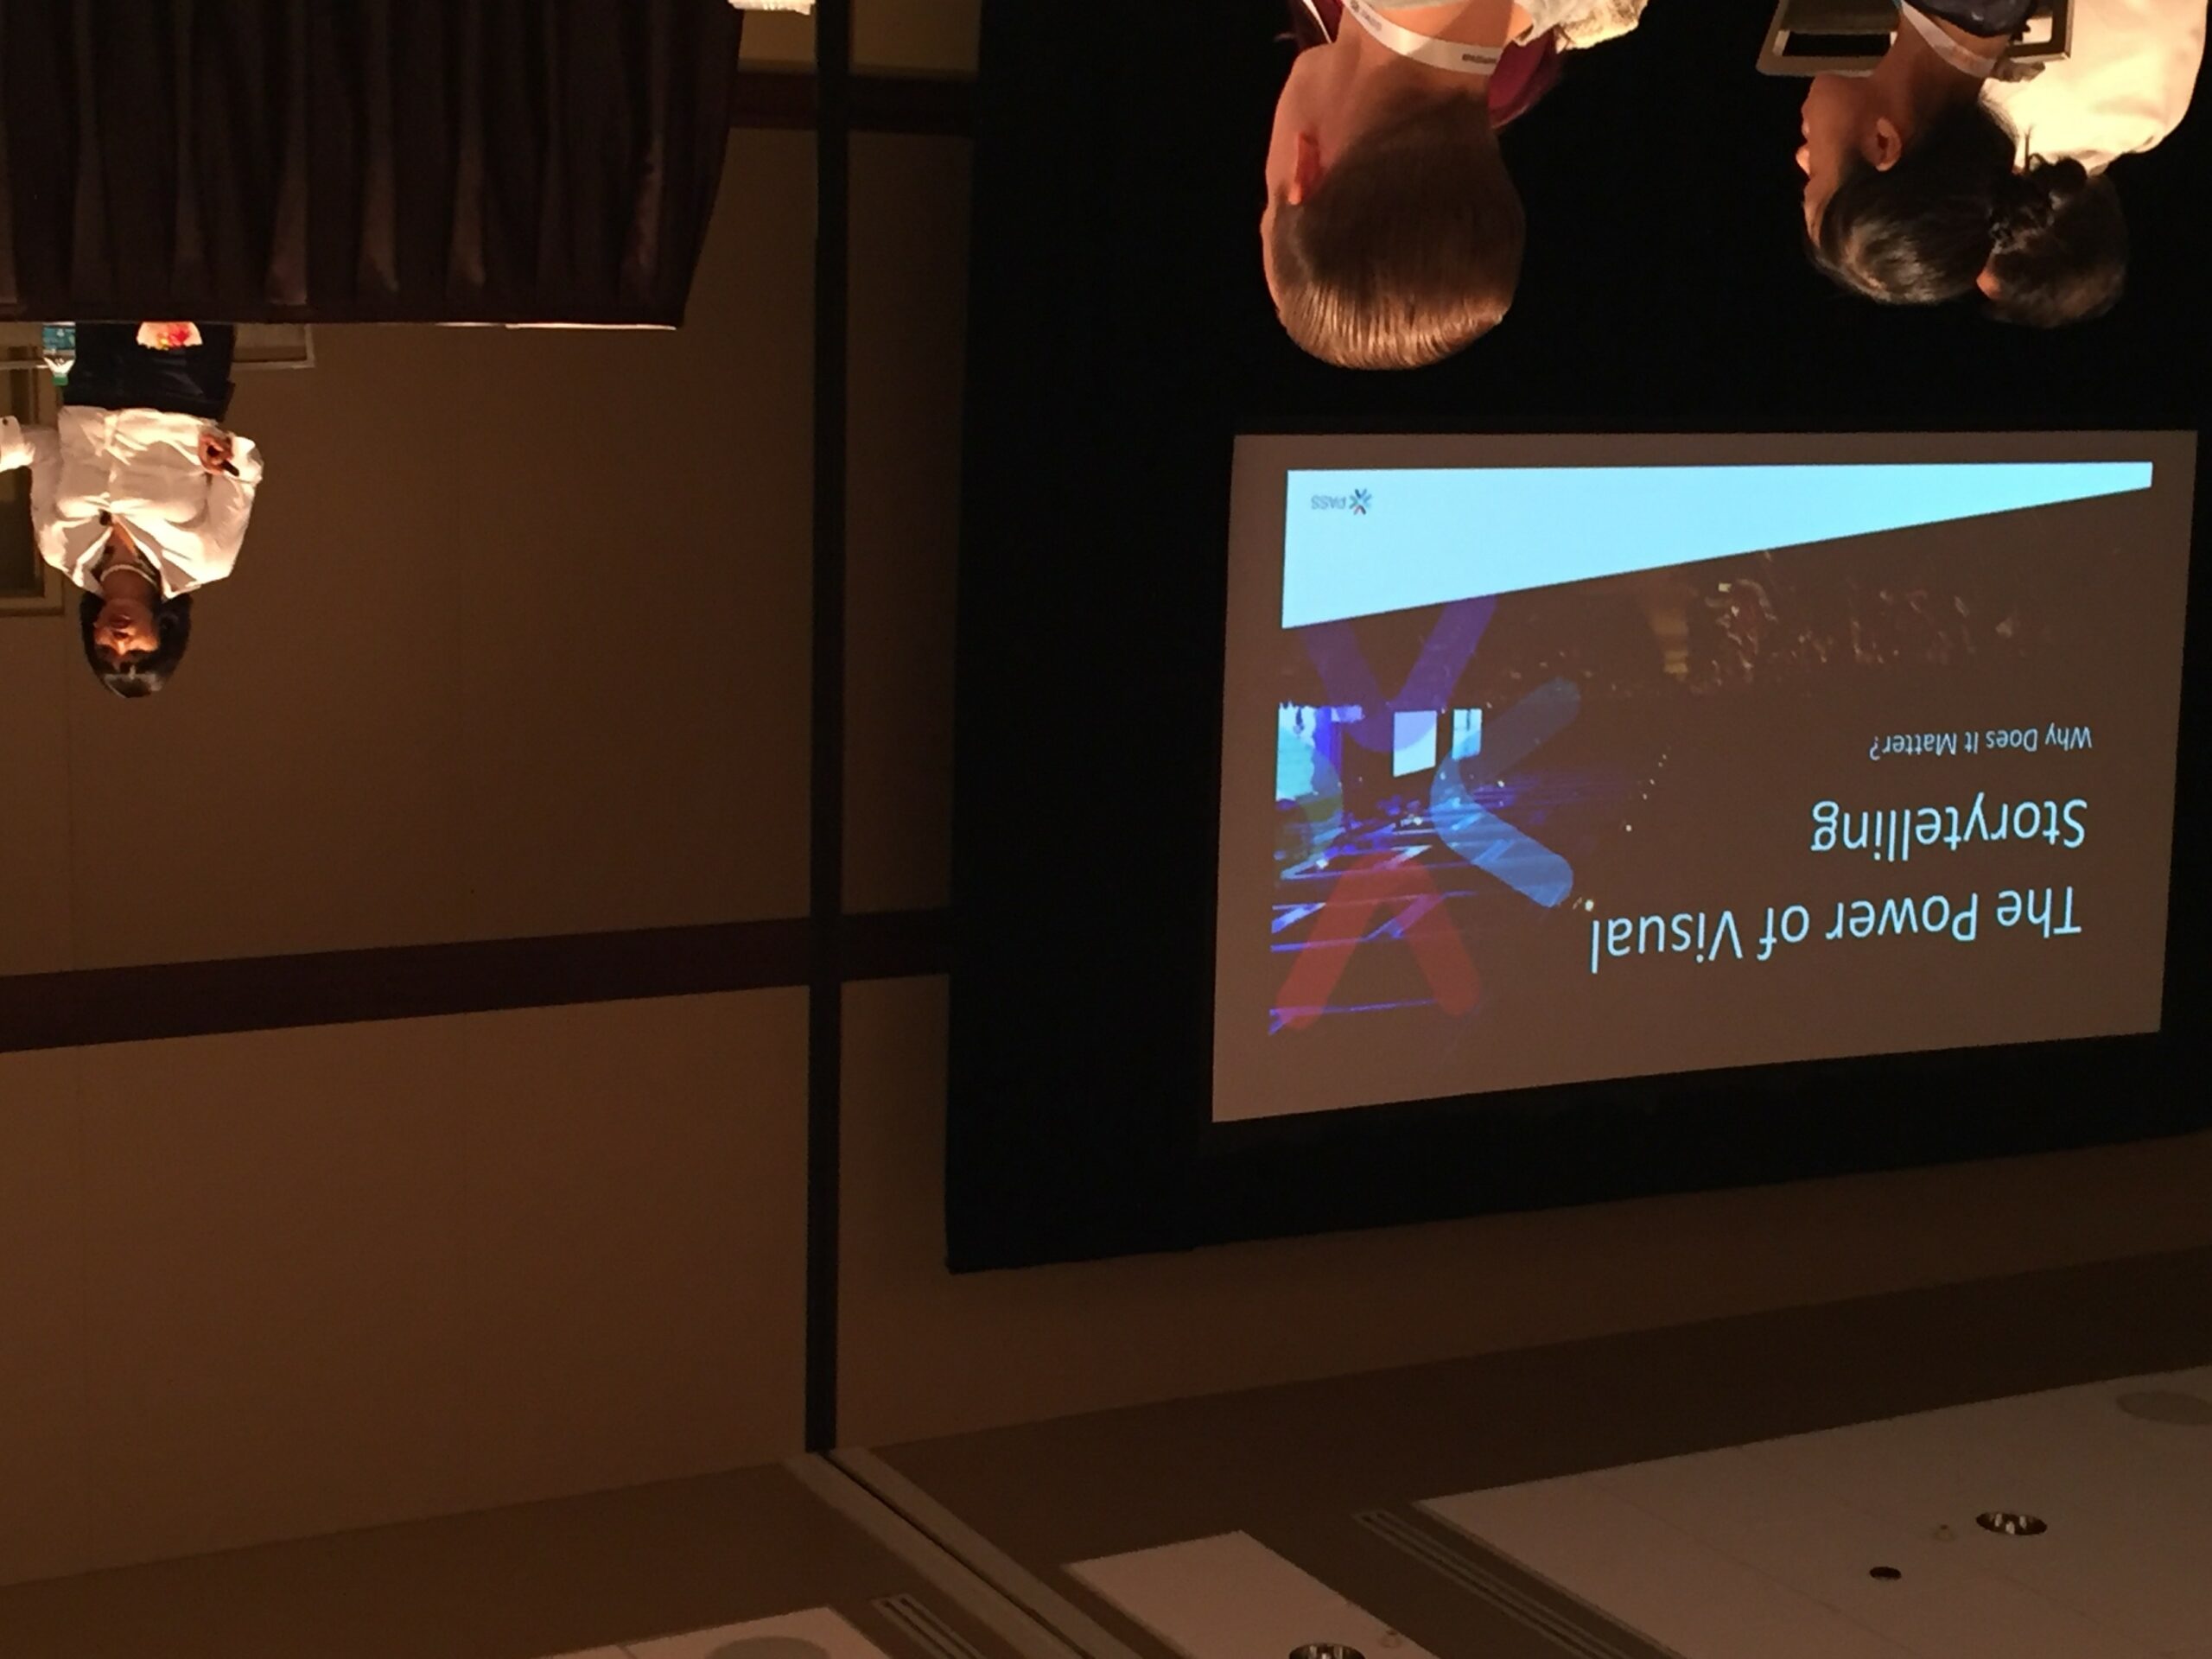
The Art and Science of Designing Smart Data story
This pre-conference session was moderated by Mico Yuk CEO and founder of BI Brainz
Mico drove us through the path of BI data visual storytelling and the importance it has to present the data in an attractive way.
She warned the session will not be technical at all, I was a bit disappointed about this point, but was curious how she will drive us there.
Starting, she made us aware of the impact on your brain of what you see , especially the color, the words.
In order to create a good storytelling, the first think is to raise the right questions, but avoid the pitfalls like asking
What do you want to see?
How do you want it to look?
What do you want to measure?
She drew a parallel with Hollywood and the film scenarios, being most of the time build on the same template.
Why can’t we do the same with data:
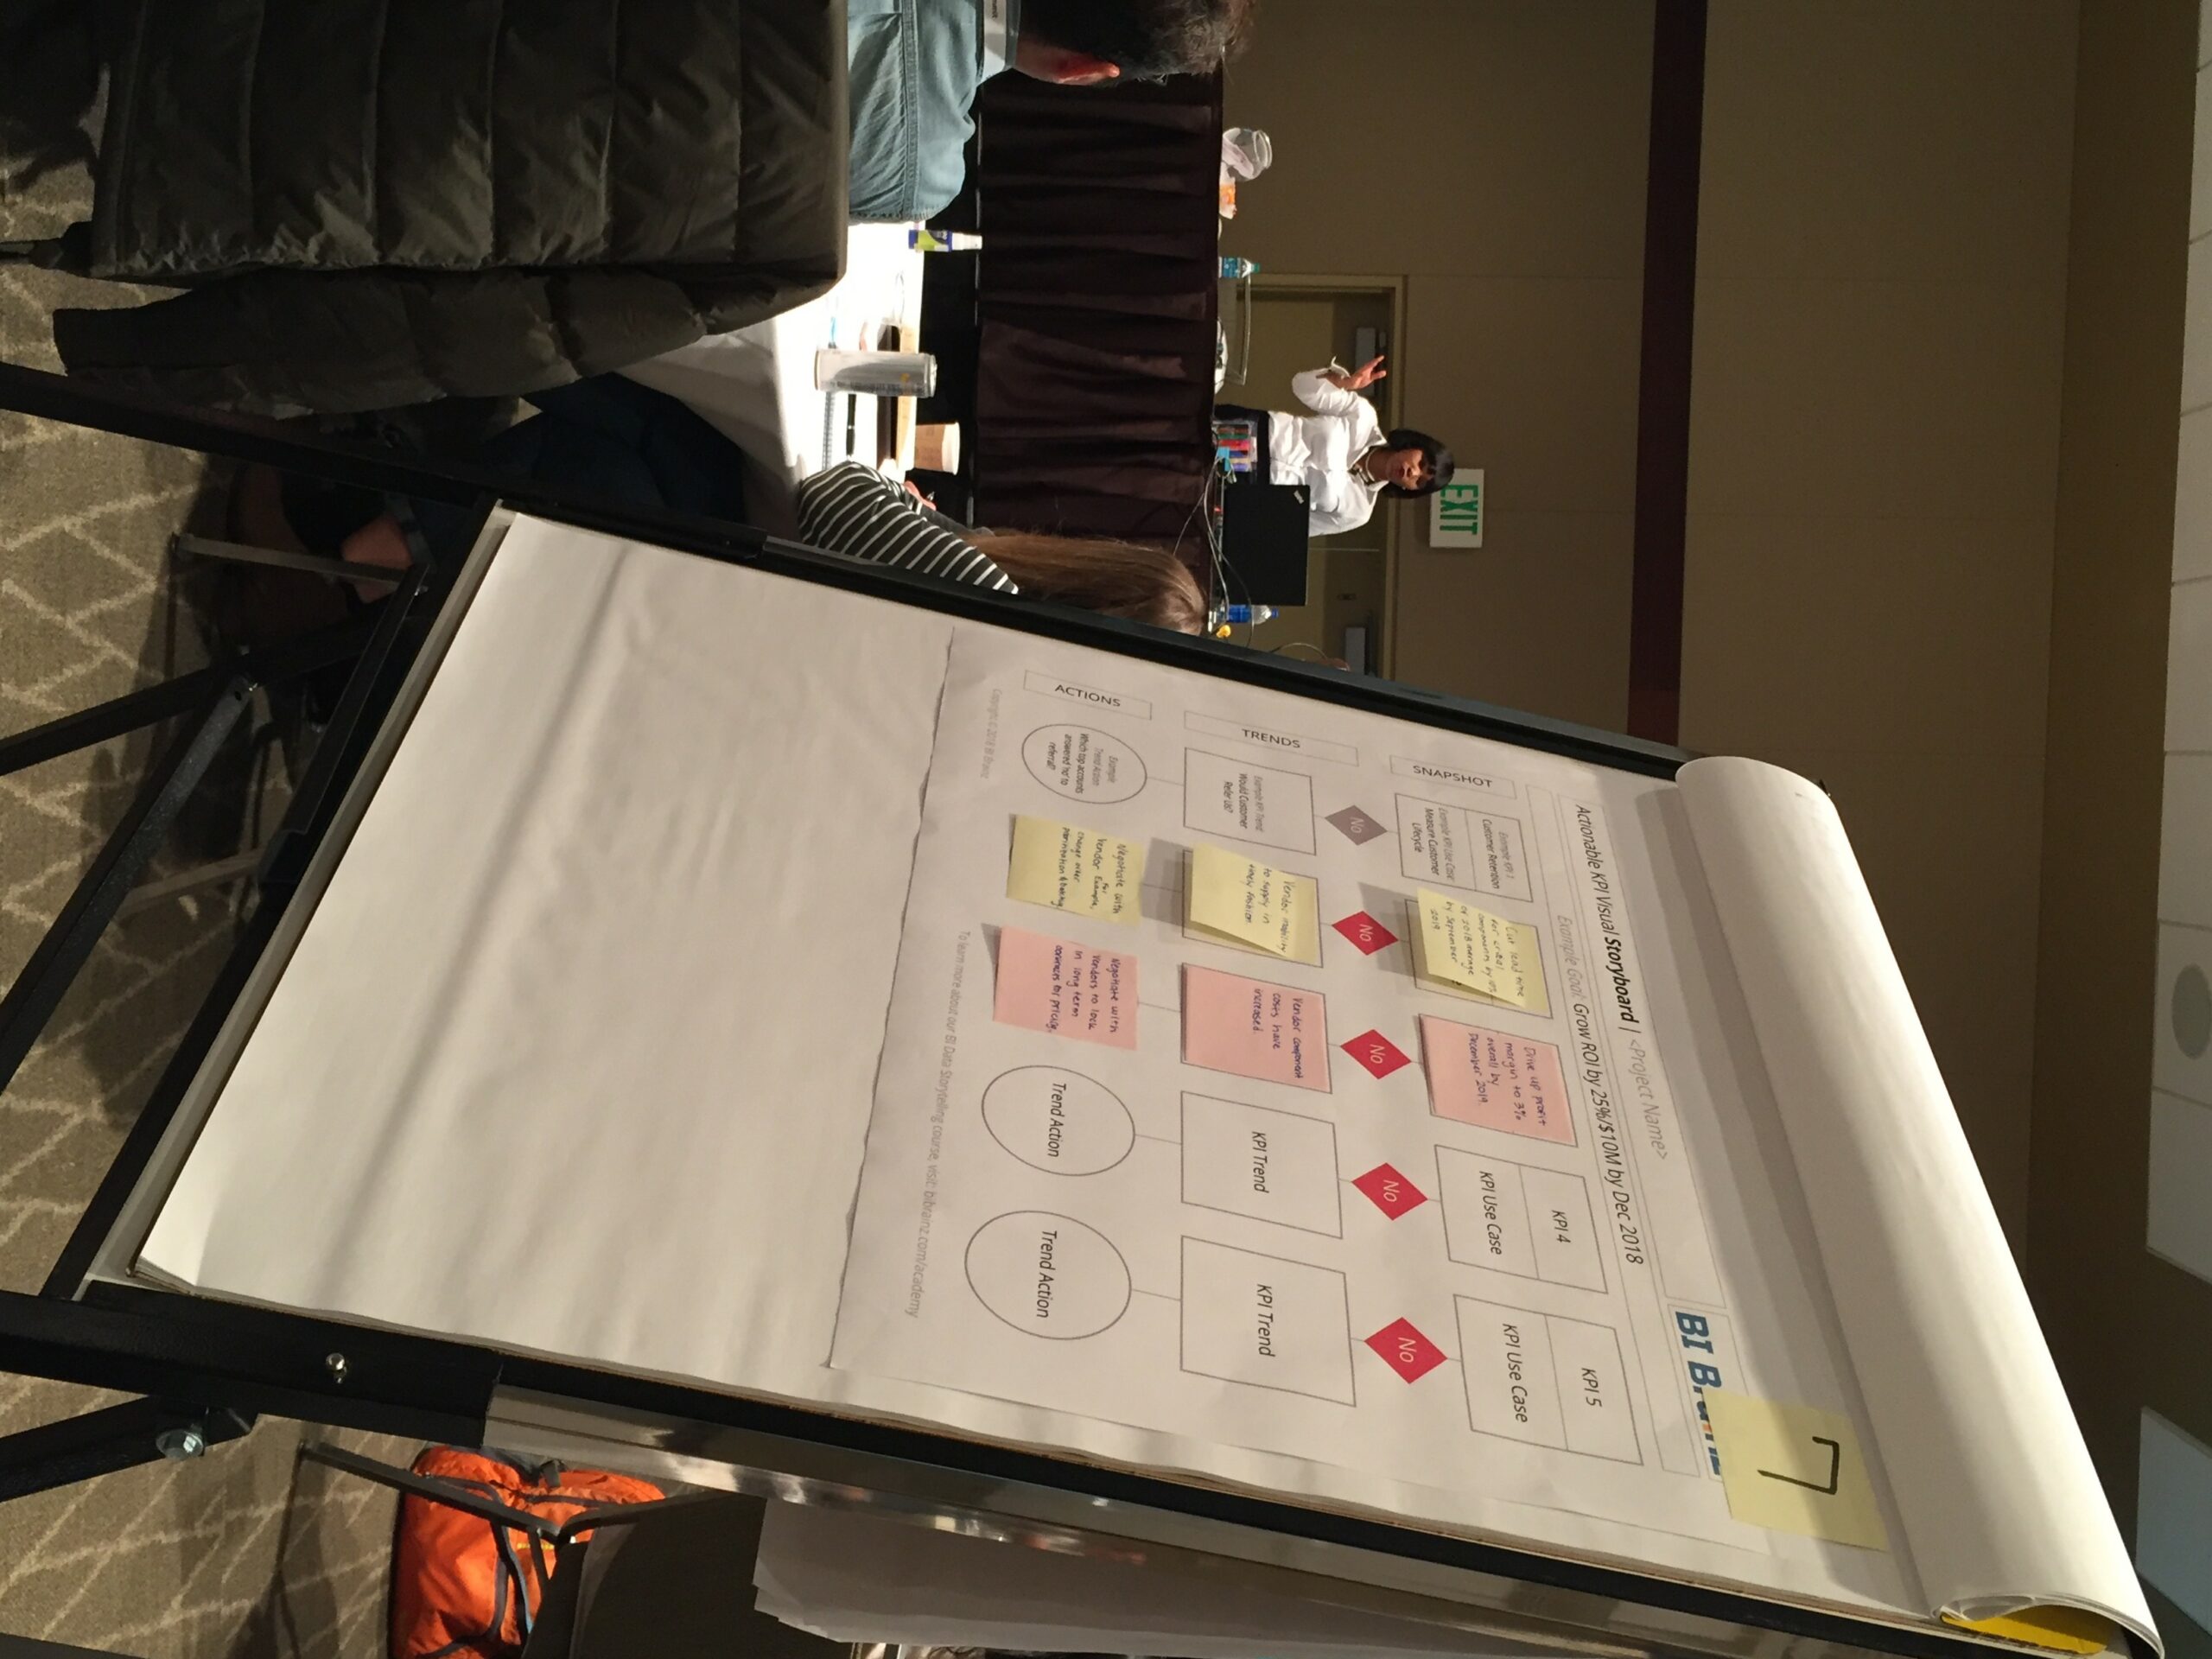
Part 1: goal
goals need to be defined clearly, They are the core of your data story and what is significant is that the goal is quantified
Part 2: Snapshot or KPI
KPI what are the figures that measure your goal
Part 3: Trends
Is the way the KPI behaves to support your goal
Part 4: Actions
There are 3 kinds of actions that can be considered to fix the issues
Reality – what we want to happen
Fallback – if reality does not work what else do you do
Wish list – what do you wish to fix the issue
To succeed in creating the different storyboard parts you have to raise the right questions:
For the goal part : What is your goal for this project? What does success look like?
For the KPI part: What KPI do you need see to hit your goal?
For the trends: If your KPI is not on target why?
A goal formulation must follow the WHW goal sample would be “Hit consumer sales target 1% by 2018”
What = hit
How much = 1% sales
When = 2018
Finally Mico showed how to display the information of the story on a dashboard following the visual storyboard tile with the following elements:
0 Goal/Kpi name
1 Where are you no
2 How di you get here
3 Where will you end up
4 what is the impact
The trick is always to prototype your storyboard outside a BI tool.
Along the day we also did some gym to relax and aware our brains
It was a hands-on session with practical exercises and we worked by group on a concrete use case to apply the storytelling methodology all along the day.
Again an interesting data analytic day…stay tuned..