I recently wanted to work on Metric Extensions automation, and realized the task was a bit more complicated than I thought. My original idea was to look into the emcli verb list, but I was unlucky. In fact, emcli does not allow you to retrieve information about Metric Extensions.
$ emcli help | grep -i metric_extension
    export_metric_extension           -- Export a metric extension to an archive file
    get_unused_metric_extensions      -- Get a list of unused metric extensions
    import_metric_extension           -- Import a metric extension archive file
    publish_metric_extension          -- Publish a metric extension for use by all administrators
    save_metric_extension_draft       -- Save a deployable draft of a metric extension
I had to dig further, looking into the Enterprise Manager SYSMAN schema.
Metric extensions are not stored under MGMT$ views
At first, I checked in the MGMT$ views, in the SYSMAN schema. They usually hold all the relevant information you need when doing automation with the Enterprise Manager. The documentation gave me nothing about Metric Extensions there, and I did not find anything either:
SQL> SELECT owner, object_name, object_type
FROM dba_objects
WHERE owner = 'SYSMAN'
AND UPPER(object_name) LIKE '%EXTENSION%'
ORDER BY object_name;

OWNER  OBJECT_NAME       OBJECT_TYPE
------ ----------------- ------------
SYSMAN EM_TYPE_EXTENSION PACKAGE
SYSMAN EM_TYPE_EXTENSION PACKAGE BODY
After a lot of searching, I found the undocumented MEXT views, where all the information on Metric Extensions is stored.
SELECT owner, object_name, object_type
FROM dba_objects
WHERE object_name LIKE '%MEXT%'
AND object_type IN ('TABLE', 'VIEW')
ORDER BY object_name;
This query returns more than a hundred objects. Among them, you can find a EM_MEXT_VERSIONS table.
EM_MEXT_VERSIONS is the catalog
EM_MEXT_VERSIONS has one row per Metric Extension. Drafts, editable versions and published metrics are all stored here, with the same name column.
SQL> DESC sysman.em_mext_versions

Name            Null?    Type
--------------- -------- -------------
MEXT_VERSION_ID NOT NULL NUMBER
TARGET_TYPE     NOT NULL VARCHAR2(256)
NAME            NOT NULL VARCHAR2(64)
VERSION         NOT NULL NUMBER
DISPLAY_NAME    NOT NULL VARCHAR2(64)
STATUS          NOT NULL NUMBER(2)
CREATION_DATE            DATE
...
Using a few useful columns, let’s see what’s inside:
SQL> SELECT name, version, display_name, target_type, status, creation_date
FROM sysman.em_mext_versions
ORDER BY name, version;

NAME                          VERSION DISPLAY_NAME         TARGET_TYPE STATUS CREATION_DATE
----------------------------- ------- -------------------- ----------- ------ -------------
ME$minimal_uptime_check             1 Minimal Uptime Check host             2 24-AUG-26
ME$minimal_uptime_check             2 Minimal Uptime Check host             2 24-AUG-26
ME$minimal_uptime_check_clone       1 Minimal Uptime Check host             2 24-AUG-26
Every Metric Extension name starts with the ME$ prefix. If you ever created a Metric Extension by hand in the web UI, the prefix is automatically added in the creation wizard. Regarding the status column, they are defined in the SYSMAN.EM_MEXT package:
- 0 –
MEXT_STATUS_EDITABLE: for Metric Extensions still under development. They can still be edited, but can’t be deployed to targets. - 1 –
MEXT_STATUS_DEPLOYABLE_DRAFT: for Metric Extensions which can’t be edited anymore, but can be deployed. Accessible only to you. - 2 –
MEXT_STATUS_PUBLISHED: for published Metric Extensions, accessible by any EM user.
Every row above shows status = 2, meaning that all versions were published.
You can of course combine multiple SYSMAN views to retrieve the list of Metric Extensions and the targets they are deployed on:
SQL> SELECT t.target_name, t.target_type, v.name AS metric_name, v.version, v.display_name AS metric_display_name
FROM sysman.em_mext_versions v
JOIN sysman.em_mext_target_assoc ta ON ta.mext_version_id = v.mext_version_id
JOIN sysman.mgmt$target t ON t.target_guid = ta.target_guid
ORDER BY t.target_name, v.name, v.version;

TARGET_NAME TARGET_TYPE METRIC_NAME             VERSION METRIC_DISPLAY_NAME
----------- ----------- ----------------------- ------- --------------------
vmogg       host        ME$minimal_uptime_check       1 Minimal Uptime Check
...
How to know what a metric extension runs ?
If a Metric Extension runs OS commands, querying SYSMAN.EM_MEXT_VERSIONS is enough to know everything about it. This becomes wrong if the Metric Extension carries a custom uploaded script or runs against the repository instead of a target. For these Metric Extensions, you should query SYSMAN.EM_MEXT_ATTACHMENTS, where the FILENAME gives you the name of the script being shipped with the metric:
SQL> DESC sysman.em_mext_attachments

Name            Null?    Type
--------------- -------- -------------
MEXT_VERSION_ID NOT NULL NUMBER
FILENAME        NOT NULL VARCHAR2(255)
FILE_CONTENTS            BLOB
I cloned ME$minimal_uptime_check with Create Like, then in the Adapter step changed the command from a literal /bin/echo to %perlBin%/perl running an uploaded script, referenced as %scriptsDir%/uptime_check.pl. Custom files are attached from the same step, in the Upload Custom Files panel:
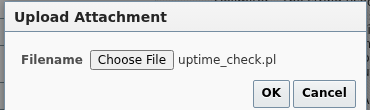
Once confirmed, the file shows up in the adapter’s file list with its size, and gets packaged into the Metric Extension itself:
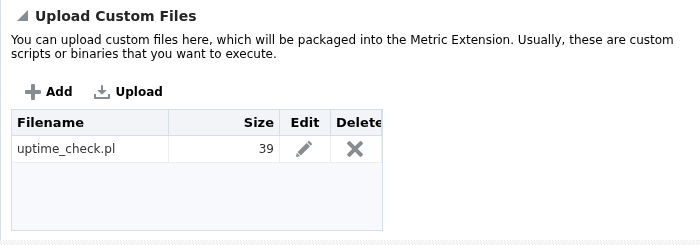
Querying the repository afterward confirms it landed exactly where the package source implied:
SQL> SELECT v.name, v.version, a.filename, DBMS_LOB.GETLENGTH(a.file_contents) AS bytes
FROM sysman.em_mext_versions v
JOIN sysman.em_mext_attachments a ON a.mext_version_id = v.mext_version_id
WHERE v.name = 'ME$script_uptime_check';

NAME                   VERSION FILENAME        BYTES
---------------------- ------- --------------- -----
ME$script_uptime_check       1 uptime_check.pl    39
Retrieving the full metric definition
There are a few other relevant LOB columns in SYSMAN.EM_MEXT_VERSIONS: METADATA_DEFINITION, COLLECTION_DEFINITION and MEXT_ARCHIVE. Selecting METADATA_DEFINITION for minimal_uptime_check returns the whole <Metric> definition as XML:
SQL> SELECT metadata_definition
FROM sysman.em_mext_versions
WHERE name = 'ME$minimal_uptime_check'
AND version = 1;

<Metric NAME="ME$minimal_uptime_check" TYPE="TABLE">
    <Display>
        <Label NLSID="NLS_METRIC_hostME$minimal_uptime_check">Minimal Uptime Check</Label>
        <Description NLSID="NLS_DESCRIPTION_hostME$minimal_uptime_check">Minimal test ME - single OS command column, no credentials.</Description>
    </Display>
    <TableDescriptor>
        <ColumnDescriptor NAME="value" TYPE="NUMBER">
            <Display>
                <Label NLSID="NLS_COLUMN_hostME$minimal_uptime_checkvalue">Value</Label>
            </Display>
        </ColumnDescriptor>
    </TableDescriptor>
    <QueryDescriptor FETCHLET_ID="OSLineToken">
        <Property NAME="command" SCOPE="GLOBAL">/bin/echo</Property>
        <Property NAME="scriptLoc" SCOPE="GLOBAL" OPTIONAL="TRUE">%scriptsDir%</Property>
        <Property NAME="args" SCOPE="GLOBAL" OPTIONAL="TRUE">em_result=1</Property>
        <Property NAME="delimiter" SCOPE="GLOBAL" OPTIONAL="TRUE">|</Property>
        <Property NAME="startsWith" SCOPE="GLOBAL" OPTIONAL="TRUE">em_result=</Property>
        <Property NAME="ENVEM_TARGET_NAME" SCOPE="INSTANCE" OPTIONAL="TRUE">NAME</Property>
        <CredentialRef NAME="OSCreds"></CredentialRef>
    </QueryDescriptor>
</Metric>
A few observations here:
FETCHLET_ID="OSLineToken"is the fetchletcommand,args,delimiterandstartsWithare the fields filled when creating the metric.
Another column, COLLECTION_DEFINITION, gives the schedule of the Metric Extension. Here, it is set to run every 15 minutes, which is the default schedule for Metric Extensions.
SQL> SELECT collection_definition
FROM sysman.em_mext_versions
WHERE name = 'ME$minimal_uptime_check'
AND version = 1;

<CollectionItem NAME="ME$minimal_uptime_check" UPLOAD="YES">
	<Schedule>
		<IntervalSchedule INTERVAL="15" TIME_UNIT="Min"/>
	</Schedule>
	<MetricColl NAME="ME$minimal_uptime_check">
	</MetricColl>
</CollectionItem>
Finally, MEXT_ARCHIVE holds the whole archive as a single BLOB. Exporting it to a file with UTL_FILE gives us a .zip file which holds the full definition of the Metric Extension. But you don’t need to do all of this, because this is the exact same zip that emcli export_metric_extension generates.
A side note on repository-side Metric Extensions, which can also be created from the web UI. For these, there are a few pre-requisites: TARGET_GUID must be the first column, the query can only reference MGMT$ repository views (not other SYSMAN tables), and it runs as the MGMT_VIEW user.
Querying SYSMAN.EM_MEXT_VERSIONS gives you the full SQL query, under the REPOS_SQL column. Use IS_REPOSITORY to filter repository-side Metric Extensions.
SQL> SELECT name, version, is_repository, repos_sql
FROM sysman.em_mext_versions
WHERE name = 'ME$sql_target_count';

NAME                VERSION IS_REPOSITORY REPOS_SQL
------------------- ------- ------------- --------------------------------------------------------------------------------------------
ME$sql_target_count       1             1 SELECT target_guid, target_type, 1 AS host_count FROM mgmt$target WHERE target_type = 'host'
I hope this will help you navigate Metric Extensions outside of the web UI, for automation work. This gave us a first glimpse of the archive format, which deserves a closer look.
![Thumbnail [60x60]](https://www.dbi-services.com/blog/wp-content/uploads/2025/05/JDE_Web-1-scaled.jpg)
![Thumbnail [90x90]](https://www.dbi-services.com/blog/wp-content/uploads/2025/11/LTO_WEB.jpg)