

A SELECT SUM(v) over a 10,000-row table, under RCSI in Azure SQL Database, with STATISTICS IO on:
Table '[dbo].[t]'. Scan count 1, logical reads 330, physical reads 0, ...
Object '[dbo].[t]'. Tempdb versions read 0, in-row PVS versions read 10000, off-row PVS versions read 210000, online index PVS versions read 0.
The Table line looks like a normal scan of 330 pages. The Object line says the read walked through 220,000 row versions, 22 per row, because another session had updated these rows 22 times in a transaction it had not committed yet. The same read took about 117 ms of CPU, against 3 ms when nothing was pending.
The Object line is new. It comes from the version store read metrics Dimitri Furman announced on the Azure SQL blog last week, which also appear in the actual plan XML returned by the server (SSMS 22.12.0 drops them, both in the graphical plan and in Show Execution Plan XML; copy the XML cell from SET STATISTICS XML ON to see them), in four extended events, in sys.dm_exec_query_stats and its procedure, trigger and function counterparts, and in sys.dm_exec_requests and sys.dm_exec_sessions (Microsoft documentation). For now they exist in Azure SQL Database and SQL database in Microsoft Fabric; Managed Instance and the next SQL Server version are announced to follow.
When I recommend RCSI, the usual worry is the open transaction someone forgot in SSMS. These metrics let me check what it actually costs the readers.
Setup
Azure SQL Database, General Purpose serverless (GP_S_Gen5_2, up to 2 vCores), where ADR and RCSI are always on. One table of 10,000 narrow rows (166 pages):
CREATE TABLE dbo.t
(
    id     int       NOT NULL PRIMARY KEY,
    v      int       NOT NULL,
    filler char(100) NOT NULL DEFAULT 'x'
);
INSERT dbo.t (id, v)
SELECT TOP (10000) ROW_NUMBER() OVER (ORDER BY (SELECT NULL)), 0
FROM sys.all_objects a CROSS JOIN sys.all_objects b;
A reader runs SELECT SUM(v) FROM dbo.t every 2 seconds under the default isolation level. I measure each read by taking version_reads, logical_reads and cpu_time from sys.dm_exec_requests for the current session just before and just after the SELECT.
Questions about your own setup? A dbi services consultant can look at your case.
Talk to an expert (opens in a new tab)Case 1: the open transaction does not touch the rows
The forgotten session updates one row in an unrelated table and goes idle:
BEGIN TRANSACTION;
UPDATE dbo.dummy SET x = 1;
-- left open
Meanwhile a writer updates every row of dbo.t 30 times, committing each update, and the reader reads after each one. I ran it once without the forgotten session and once with it:
| Forgotten session | Max version reads per read | Logical reads per read | Avg CPU per read |
|---|---|---|---|
| no | 0 | 329 to 330 | 2.7 ms |
| yes | 0 | 329 | 2.8 ms |
The forgotten session did freeze version cleanup. In a separate run with the same 30 updates, I logged sys.dm_tran_persistent_version_store_stats every few seconds. Without the dormant session, the persistent version store (PVS) went back down from 43,784 KB to 9,160 KB about 20 seconds after the last update. With it, oldest_active_transaction_id went from 0 to a non-zero value and the PVS stayed at 74,696 KB for 110 seconds of idle time, until the ROLLBACK; about 45 seconds later it was down to 16,520 KB.
The version chains behind each row kept growing, and the reader ignored them. RCSI needs the last version committed before the statement started, and after a committed update that is the row on the page.
Case 2: the open transaction updates the rows being read
Now the forgotten session updates the rows the reader reads, 30 times, and never commits:
BEGIN TRANSACTION;
UPDATE dbo.t SET v = v + 1;   -- repeated 30 times, 2 seconds apart
-- no COMMIT
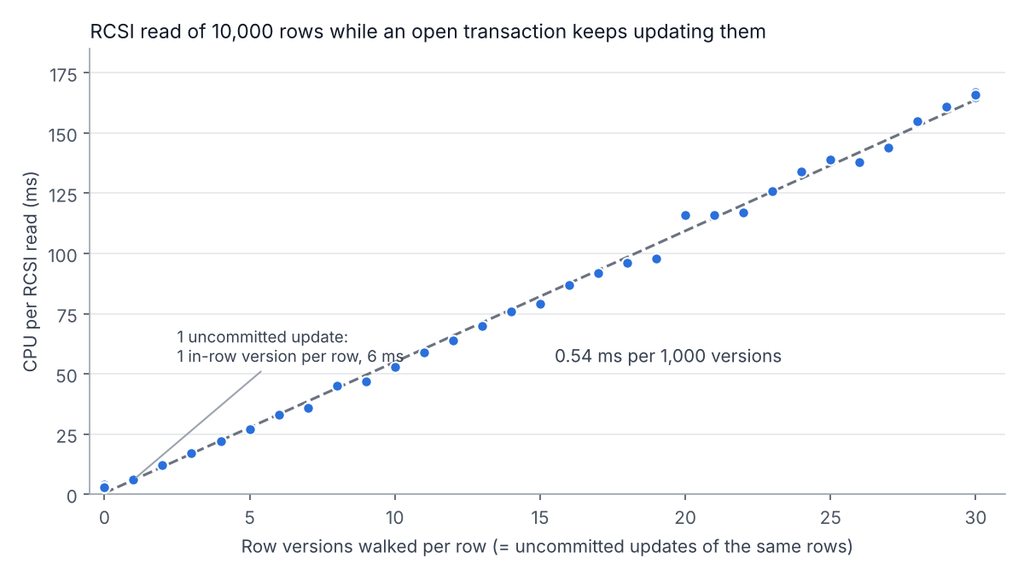
The reader cannot use the row on the page any more, because its value is not committed, so it walks back to the last committed version. Each uncommitted update adds exactly one version per row to that walk: 10,000 version reads after the first update, 300,000 after the thirtieth.
The first one is cheap. That version was stored in-row, so the read cost 164 extra logical reads (the rows got wider) and went from 3 to 6 ms of CPU. Every later update pushed one more version off-row, each costing a page read: logical reads went up by exactly 10,000 per update, and CPU grew linearly at 0.54 ms per 1,000 versions (a figure for this test only: it will vary with the size of the modified data and the service tier). After 30 updates the same read took 167 ms instead of 3.
In my other run of this test, the first version went off-row immediately and cost 10,000 page reads from the start. Counting the snapshot runs mentioned below, the first version was in-row in three runs out of four, so in-row is frequent, not guaranteed.
What this means for RCSI
Case 2 is a worst case on purpose: one transaction updating every row of the table 30 times without committing, while readers scan all of it. In the OLTP workloads I work on, a transaction usually changes a given row only once, so an RCSI read walks zero versions on committed rows and one on a row someone is still changing. That single version was in-row, and cheap, in three of my four runs; off-row, it costs one page read per row. The walk gets longer only when the same row changes many times within one transaction, or, by the same rule, many times during one long-running statement that reads it.
Snapshot isolation is a different story, and it is less common in the workloads I see. A snapshot transaction reads the database as of its start, so every committed change since then is one more version to walk. In a separate test with the same table, a snapshot transaction rereading it while 30 updates were committed elsewhere walked one version per row per update, 300,000 in the end, at a similar CPU cost per version.
A forgotten transaction that only touched other tables costs PVS space and leaves RCSI readers alone.
What was already known
None of this mechanism is new: Sunil Agarwal described the cost of walking version chains in 2008, and Josh Darnell and Forrest McDaniel showed in 2019 that STATISTICS IO does not count version store reads, which still holds with the PVS (330 logical reads on the Table line, 210,330 in sys.dm_exec_requests for the read at the top). What the new metrics add is a direct count per query.
Queries to keep
Which cached statements pay for versions:
SELECT TOP (10)
       qs.total_version_reads,
       qs.execution_count,
       qs.total_logical_reads,
       qs.total_worker_time,
       SUBSTRING(st.text, qs.statement_start_offset / 2 + 1,
                 (CASE qs.statement_end_offset WHEN -1 THEN DATALENGTH(st.text)
                       ELSE qs.statement_end_offset END - qs.statement_start_offset) / 2 + 1) AS statement_text
FROM sys.dm_exec_query_stats AS qs
CROSS APPLY sys.dm_exec_sql_text(qs.sql_handle) AS st
ORDER BY qs.total_version_reads DESC;
Whether something is holding version cleanup:
SELECT persistent_version_store_size_kb, oldest_active_transaction_id
FROM sys.dm_tran_persistent_version_store_stats
WHERE database_id = DB_ID();
If version reads are high on a few statements, look for a transaction that keeps modifying the rows they read, or for a long snapshot transaction. If the PVS grows while version reads stay near zero, the cost is storage and your readers are fine for now.
Dimitri Furman asks whether version reads should be added to Query Store. I would like to see them there: a growing version walk is the kind of drift you only notice in history.
Reproducing it
Two sessions on the same Azure SQL Database (GP_S_Gen5_2, November 2026, default settings), the table from the setup above, recreated before each test. Each read is measured like this:
SELECT @vr0 = version_reads, @lr0 = logical_reads, @cpu0 = cpu_time
FROM sys.dm_exec_requests WHERE session_id = @@SPID;

SELECT @s = SUM(v) FROM dbo.t OPTION (MAXDOP 1);

SELECT version_reads - @vr0, logical_reads - @lr0, cpu_time - @cpu0
FROM sys.dm_exec_requests WHERE session_id = @@SPID;
The rest is loops: 30 updates of every row 2 seconds apart (committed in case 1, inside the open transaction in case 2), one measured read after each, and sys.dm_tran_persistent_version_store_stats polled every few seconds for the PVS size.