With SQL Server 2025, Microsoft lets the database engine call an AI model by itself. sp_invoke_external_rest_endpoint sends an HTTPS request straight from T-SQL, to Azure OpenAI or to any other REST service, so an embedding or a completion no longer needs application code in between.
But what happens under heavy pressure, when hundreds of sessions make that call at the same moment and the model takes its time to answer? I ran this scenario on SQL Server 2025 and on Azure SQL Database, with the same procedure and the same load script. The two platforms do not react the same way at all.
| 100 sessions calling a 30-second endpoint | SQL Server 2025 | Azure SQL Database, 2 vCores | SQL Server 2025 with Resource Governor |
|---|---|---|---|
| Calls sent to the endpoint at once | 100 | 22 | 22 |
| What happens to the others | nothing holds them back | refused at once, error 10928 | queued, all served after 150 s |
| Worker threads held | 100 | 22 | 100 |
The documentation of the procedure describes a cap at 10% of the worker threads. That is not what I measured. Azure SQL Database does cap the calls in my tests, but at 15% of its workers: 22 calls at 2 vCores, 45 at 4 vCores, 30 on a Standard S3. SQL Server 2025 has no cap at all, and the rest of this post shows what happens without it.
The lab
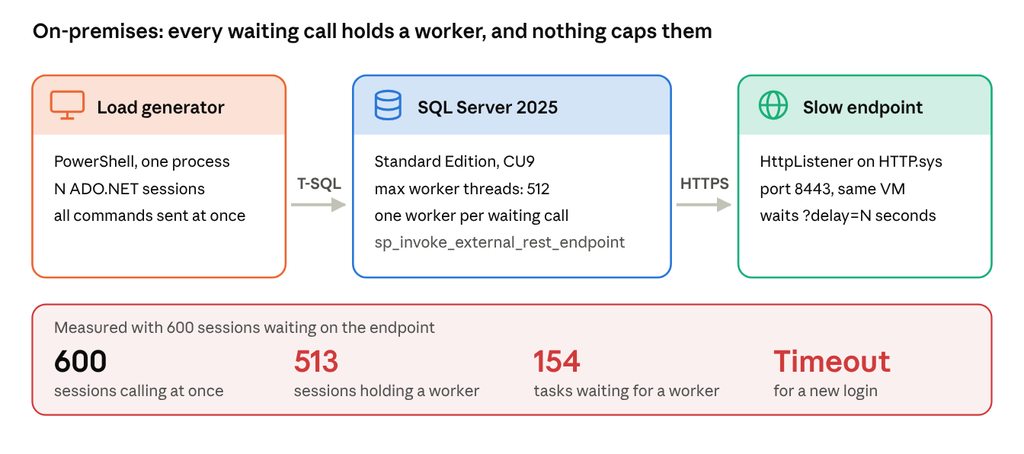
The on-premises setup has three parts, all on one virtual machine (Windows Server 2022, 2 vCPUs): a load generator, a SQL Server 2025 Standard instance, and a small HTTPS endpoint that answers after the delay given in the URL.
The call is wrapped in a procedure, so that every session runs exactly the same thing:
CREATE OR ALTER PROCEDURE dbo.CallSlowAi @delay int, @timeout smallint = 230
AS
BEGIN
    DECLARE @url nvarchar(400) = CONCAT(N'https://<YOUR_VM>:8443/?delay=', @delay);
    DECLARE @ret int, @resp nvarchar(max);
    EXEC @ret = sp_invoke_external_rest_endpoint @url = @url, @method = 'POST',
         @payload = N'{"input":"hello"}', @timeout = @timeout, @response = @resp OUTPUT;
    RETURN @ret;
END
The load generator is a PowerShell function that opens N connections without pooling, sends EXEC dbo.CallSlowAi @delay = 30 on all of them at the same moment, and records for each session the elapsed time and the error number. One process, so the client itself does not slow the VM down.
Before measuring SQL Server, I called the endpoint directly with 200 parallel requests: they all came back in 30.6 seconds. The endpoint is not the bottleneck.
On-premises: no limit, until the workers run out
A worker thread is what SQL Server uses to execute a request: one request running, at least one worker busy. The instance has a fixed pool of them, set by max worker threads; with the default setting on this 2-vCPU machine, that is 512. When they are all taken, new work waits with the THREADPOOL wait type, and that includes logging in, because a login needs a worker too (see my previous blog about this wait type).
Three words matter here, and their numbers should not be added together. A session is a connection. When it runs a request, the request is split into one or more tasks, and each task needs a worker thread to run. A simple call like ours is one task, so one worker; a parallel query would take several. The worker counts I quote also include SQL Server’s own background tasks: about 45 workers on this idle instance. A wait type, on the other hand, is counted per task, whoever owns it.
A session waiting for the endpoint reports the HTTP_EXTERNAL_CONNECTION wait type and keeps its worker thread for the whole wait: every waiting call added one worker to that baseline.
With 300 sessions, SQL Server sent everything at once. I counted 300 TCP connections from sqlservr.exe to port 8443, and all calls returned together:
ErrorNumber : 0
Sessions    : 300
MinSec      : 30.2
MaxSec      : 34.5
With 600 sessions, the instance has only 512 worker threads to give. 510 connections were open at the same time, and the calls finished in two groups:
Finished after (s)   Sessions
30                   193
40                   316
50                     1
60                    90
The first 509 calls left immediately, one per available worker. The last 91 did not wait for the endpoint: they waited for a worker. No error was raised at any point, and nothing held the calls back.
What the rest of the instance sees
I measured the saturation itself during an earlier run of the same 600 sessions, with HTTP/2 still enabled on the endpoint (see below). From the dedicated admin connection:
active_workers  queued_tasks
556             154

-------------------------------------

wait_type                  n
HTTP_EXTERNAL_CONNECTION   513
THREADPOOL                 154
At that moment an ordinary sqlcmd connection failed:
Sqlcmd: Error: Microsoft ODBC Driver 17 for SQL Server : Login timeout expired.
Sqlcmd: Error: Microsoft ODBC Driver 17 for SQL Server : Unable to complete login process due to delay in prelogin response.
The admin connection kept answering, and the instance recovered by itself once the calls completed. KILL also works at once on a waiting session (error 596 on the client side).
HTTP/2 changes the shape, not the outcome
HTTP.sys, which hosts my test endpoint, offers HTTP/2 by default. In that mode SQL Server opened 6 TCP connections instead of one per call, and only 100 calls were in flight per host name. The same 300 sessions then finished in three waves:
Finished after (s)   Sessions
30                   100
60                   100
90                   100
The queued sessions show the same HTTP_EXTERNAL_CONNECTION wait and hold a worker while they queue, so the pool empties just as well: the 556 workers above were measured in this mode. The queue has a second effect. @timeout keeps running while a call waits its turn. With a 30-second endpoint and @timeout = 45, the first 100 calls succeeded and the 100 queued ones failed after 45.5 seconds with error 31629, The external rest endpoint execution exceeded the timeout value, although the endpoint was answering normally.
Turning HTTP/2 off on the endpoint removes that queue. I disabled it in HTTP.sys (EnableHttp2Tls and EnableHttp2Cleartext set to 0, then a reboot) and replayed the same load:
| 300 sessions, 30-second endpoint | HTTP/2 | HTTP/1.1 |
|---|---|---|
| TCP connections opened by SQL Server | 6 | 300 |
| Calls in flight at once | 100 | 300 |
| Last call returns after | 90 s | 34.5 s |
The waves are gone and so are the timeouts caused by the queue. It is not a fix for the instance, though. Each call still holds a worker, the 600-session run at the top of this section was made in HTTP/1.1, and the endpoint now receives every call at once. With a real AI provider you also do not choose the protocol: the server does.
I did not capture the HTTP/2 negotiation, so I cannot say which side sets the figure of 100. What the two modes show together is that SQL Server applies no cap of its own.
But the documentation says 10%?
The page of the procedure is marked as applying to SQL Server 2025, Azure SQL Database, Azure SQL Managed Instance and SQL database in Microsoft Fabric. Its throttling section reads:
The number of concurrent connections to external endpoints done via
sp_invoke_external_rest_endpointare capped to 10% of worker threads, with a maximum of 150 workers.
It adds that a call made beyond the limit raises error 10928. With 512 worker threads, I expected about 51 calls to pass and the others to fail. I got neither the cap nor the error, on RTM as on CU9.
The next sentence of that section gives a hint: it speaks of a single database and of an elastic pool, two notions that only exist in Azure SQL Database. So I ran the same test there.
Azure SQL Database: 22 calls, then an error
Azure SQL Database only calls endpoints from a closed list of Azure services, so the slow endpoint becomes an Azure Function. The database is a single Azure SQL Database in Switzerland North. I started on the vCore model, General Purpose serverless on standard-series (Gen5) hardware with 2 vCores maximum, then scaled the same database to 4 vCores, and finally to Standard S3 in the DTU model. The function runs on the Consumption plan, Node.js 22, in the same region. The procedure is the same, with the URL of the function, and the load script only changes its connection string.
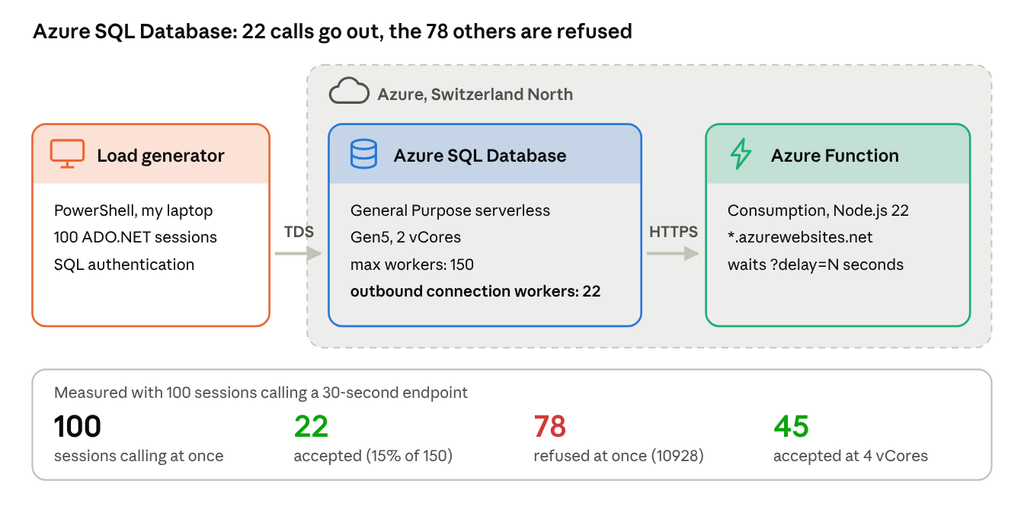
Before any load, the governance view of the database already shows a dedicated limit:
SELECT primary_group_max_workers, primary_group_max_outbound_connection_workers
FROM sys.dm_user_db_resource_governance;
primary_group_max_workers  primary_group_max_outbound_connection_workers
150                        22
I stated my bet before running the load: 22 successes, 78 errors. Result for 100 sessions calling a 30-second endpoint:
ErrorNumber  Sessions  Finished after (s)
0            22        30
10928        78        0
Resource ID : 4. The outbound connection worker limit for the database is 22 and has been reached.
The 78 rejected sessions got their answer immediately, which leaves the database 128 of its 150 workers for everything else, whatever the endpoint does.
Two remarks on this test. The ratio is 15%, not the documented 10%. At 2 vCores the database has 150 workers and a limit of 22. I scaled it to 4 vCores: 300 workers, a limit of 45, and the same load gave 45 successes and 55 errors. In the DTU model, a Standard S3 shows 200 workers and a limit of 30. This is one database, in one region, read on three service objectives and load-tested on two. The ratio could differ on other tiers, hardware generations or Hyperscale, and Microsoft may change it: treat 15% as what I observed, not as a rule. On the endpoint side I needed to do a small adjustment as well: an Azure Function on the Consumption plan served only 100 concurrent requests per instance until I raised maxConcurrentRequests in host.json. A direct test of 200 parallel requests took 62.8 seconds before the change and 30.4 after.
The same limit on-premises, with Resource Governor
SQL Server 2025 exposes nothing comparable. On CU9, sys.dm_user_db_resource_governance does not exist, no system column deals with outbound connections, and the only related configuration option is the on/off switch external rest endpoint enabled.
What SQL Server does have is Resource Governor, and a workload group can limit its number of concurrent requests. I created a group with the Azure value and sent the sessions of the load generator into it through their application name:
USE master;
GO
CREATE WORKLOAD GROUP AiCalls WITH (GROUP_MAX_REQUESTS = 22) USING [default];
GO
CREATE FUNCTION dbo.RgClassifier() RETURNS sysname WITH SCHEMABINDING
AS
BEGIN
    RETURN CASE WHEN APP_NAME() = N'AiLoad' THEN N'AiCalls' ELSE N'default' END;
END
GO
ALTER RESOURCE GOVERNOR WITH (CLASSIFIER_FUNCTION = dbo.RgClassifier);
ALTER RESOURCE GOVERNOR RECONFIGURE;
Same load as on Azure, 100 sessions calling a 30-second endpoint:
ErrorNumber  Sessions
0            100

Finished after (s)   Sessions
30                   22
60                   22
90                   22
120                  22
150                  12
The limit is applied to the unit: never more than 22 calls reach the endpoint. But there is no error. Every session ends up being served, and the last ones wait two minutes for it.
Where Resource Governor stops
During the second wave of that test, the group, the waits and the workers looked like this:
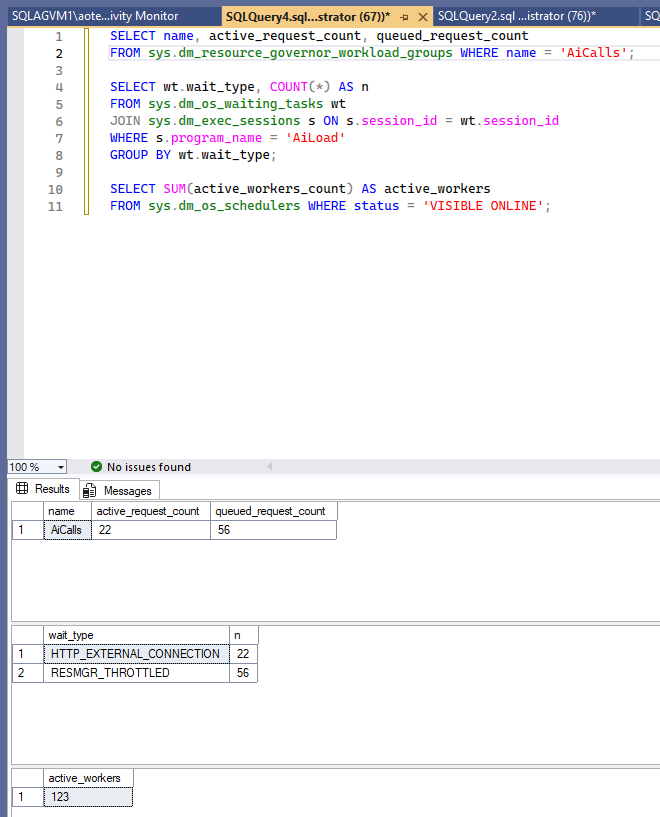
The 56 queued sessions wait on RESMGR_THROTTLED, and each of them has a worker. The instance counts 123 active workers against 45 at rest: 78 more, exactly the 22 calls in flight plus the 56 sessions in the queue.
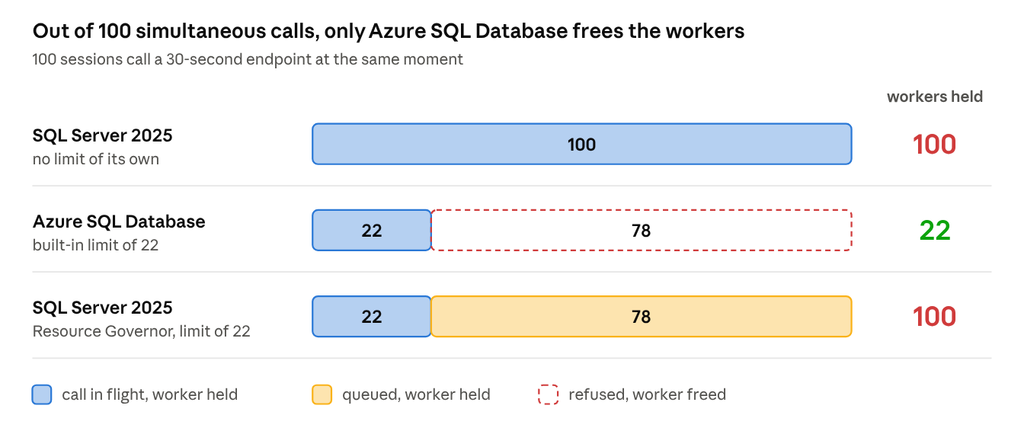
| Beyond the 22nd call | Azure SQL Database | SQL Server 2025 with Resource Governor |
|---|---|---|
| What the session gets | error 10928, immediately | a place in a queue |
| Worker of that session | released | held until its turn comes and the call returns |
| Calls reaching the endpoint | 22 | 22 |
| Worker pool | protected | not protected |
Resource Governor protects the service being called. It does not protect the instance. With 600 sessions classified in that group, 22 calls would be in flight and the 578 others would still be queued, each holding a worker, against a pool of 512. I did not run that last case; it follows from the two measurements above.
What to take from this
On SQL Server 2025, every session waiting for an external endpoint holds a worker thread, and the engine sets no limit on how many can wait at once. Azure SQL Database does have such a cap, at 15% of its workers in my tests rather than the documented 10%, and a call beyond it is refused immediately. On-premises, a slow AI service plus a concurrent application is enough to exhaust the worker pool and to keep new connections out, with no blocking chain to look for and an error message, when there is one, that points at the endpoint.
The difference is also one of scope. In Azure SQL Database, the limit belongs to the database: a flood of slow calls is refused at the door of that database, and the 128 workers left keep it running. In SQL Server, the worker pool belongs to the instance. Every database on it shares the same 512 workers, so one application calling a slow AI service can lock out the users of all the others.
Resource Governor can cap the number of calls sent to the service, in Standard Edition too, but it queues the surplus instead of refusing it, and a queued session costs a worker. If you want the Azure behavior, the refusal has to come from the code that makes the call, or from the application in front of it. Make sure you can reach the dedicated admin connection before you need it: it works locally out of the box (sqlcmd -A), but from another machine it requires the remote admin connections option. It was the only way in during the saturation, and KILL on the waiting sessions frees their workers at once.
![Thumbnail [60x60]](https://www.dbi-services.com/blog/wp-content/uploads/2025/11/LTO_WEB.jpg)
![Thumbnail [90x90]](https://www.dbi-services.com/blog/wp-content/uploads/2024/03/AHI_web.jpg)
![Thumbnail [90x90]](https://www.dbi-services.com/blog/wp-content/uploads/2025/05/martin_bracher_2048x1536.jpg)