“Why won’t my table read in parallel???”
That was more or less the question Roger Schönmann and I were asking ourselves while staring at two execution plans on a SQL Server 2025 lab instance. The first query scanned the whole Users table of the StackOverflow2010 database on a single thread and took five seconds (elapsed time). The second one scanned exactly the same pages, with a WHERE clause on Location, got a parallel plan and finished in under three hundred milliseconds.
The obvious reading is that parallelism made the difference, and that the optimizer made a poor choice by keeping the first query serial. The numbers ended up saying the opposite, including once I had forced the parallel plan by hand.
The two queries
Everything below ran on SQL Server 2025, cost threshold for parallelism left at its default of 5 (for this lab only 😉). The Users table holds 299’398 rows on 7’401 pages. Each query ran on a cold buffer pool, so both paid the same disk reads.
CHECKPOINT;

DBCC FREEPROCCACHE; -- on a lab only
DBCC DROPCLEANBUFFERS;  -- on a lab only

SET STATISTICS IO, TIME ON;

SELECT * FROM dbo.Users;

SELECT * FROM dbo.Users
WHERE Location LIKE '%Denmark%';
| Scan count | Read-ahead reads | CPU | |
|---|---|---|---|
No WHERE | 1 | 7’401 | 1.016 s |
LIKE '%Denmark%' | 5 | 7’401 | 0.266 s |
The read-ahead counts match to the page. The leading wildcard makes the predicate non-sargable, so the second query cannot seek and has to read every row to test it, exactly like the first one. The filter only reduces the rows returned.
The serial query needs about one second of CPU in total, so even a perfect parallel plan could only shave a fraction off it.
How the optimizer decides
The cost threshold for parallelism is only an entry point when the query planner is building the tree of possible execution plans. When the serial plan costs more than the threshold, the optimizer also builds a parallel alternative, then keeps whichever of the two is cheaper.
The costing of the parallel alternative is explained in detail by Adam Machanic: CPU costs are divided by the degree of parallelism, I/O costs are not divided at all, and the exchange operators added to the plan come with a cost of their own.
The plan XML of the serial query gives everything needed to do the arithmetic.
<OptimizerHardwareDependentProperties ... EstimatedAvailableDegreeOfParallelism="2" ... />
<RelOp AvgRowSize="4468" EstimateCPU="0.329495" EstimateIO="5.46609"
       EstimateRows="299398" PhysicalOp="Clustered Index Scan"
       EstimatedTotalSubtreeCost="5.79558" ... >
Around 90% of the scan cost is I/O, which the parallel plan keeps as is. The part that can shrink is 0.33, divided by the two threads the optimizer assumes for costing on this instance, so the best a parallel scan can hope to save is roughly 0.16. In exchange, the plan needs a Gather Streams operator to bring every row back to a single thread, and here that means 299’398 rows the optimizer believes to be 4’468 bytes wide on average, mostly because AboutMe is an nvarchar(max).
There was no NonParallelPlanReason in the XML, the optimization level was FULL, and nothing in the plan pointed to an inhibitor. The optimizer looked at the parallel alternative and turned it down on cost.
Forcing the parallel plan anyway
Understanding the costing did not stop me from wanting to see the parallel plan run. Three attempts failed.
OPTION(QUERYTRACEON 8649, RECOMPILE) compiled with trace flag 8649 listed under IsCompileTime="true", and the plan stayed serial with no NonParallelPlanReason. I cannot say with certainty why the flag did not win here. USE HINT('ENABLE_PARALLEL_PLAN_PREFERENCE') gave the same result.
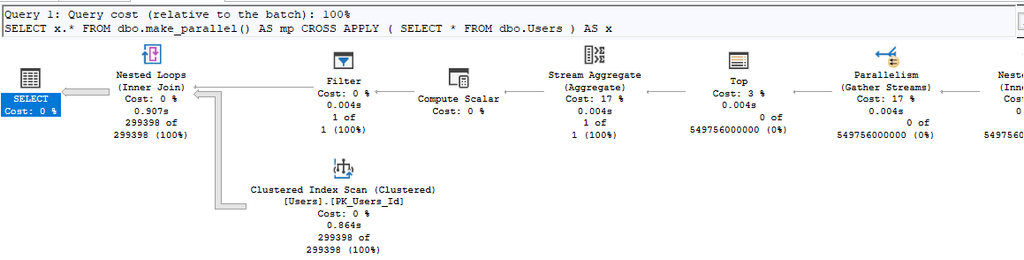
Adam Machanic‘s make_parallel() function, cross applied to the query as his article describes, produced a spectacular plan with a Gather Streams estimated at 549’756’000’000 rows. The optimizer parallelised the fake branch of the function, closed the parallel zone before its aggregate, and left the scan of Users on the outer serial Nested Loops.
SELECT x.*
FROM dbo.make_parallel() AS mp
CROSS APPLY
(
    SELECT * FROM dbo.Users
) AS x;
What finally worked was going after the estimate instead of the plan. If the Gather Streams is what the optimizer refuses to pay for, it only has to believe that almost no rows will cross it. So I gave it a filter it judges extremely selective, and that removes nothing at runtime:
declare @impossiblevalue int = 0;

SELECT * FROM dbo.Users WHERE reputation >= @impossiblevalue
OPTION (OPTIMIZE FOR (@impossiblevalue = 1000000));
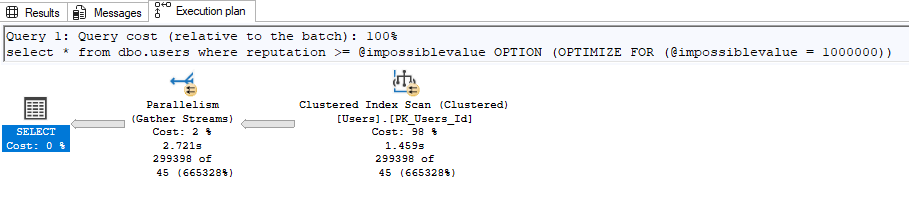
Finally, some parallelism has been introduced!
The statistics show nothing anywhere near a million reputation points, so the plan is compiled for an estimate of 45 rows (based on the density vector). At runtime @impossiblevalue is 0 and every one of the 299’398 users comes back. The optimizer, fooled into seeing a nearly free Gather Streams, finally picks the parallel plan.
| Scan count | Read-ahead reads | CPU | |
|---|---|---|---|
| Serial (optimizer choice) | 1 | 7’401 | 1.016 s |
| Parallel (forced) | 5 | 7’401 | 2.844 s |
And let’s see the main wait statistics of both executions :
| Wait | Serial | Forced parallel |
|---|---|---|
| PAGEIOLATCH_SH | 41 ms | 2’237 ms |
| CXPACKET | none | 20’935 ms (60’181 waits) |
CXPACKET is the price of the streams we created by introducing parallelism. 4 producer threads fill packets for a single consumer, which can only hand rows to SSMS as fast as SSMS accepts them. When the exchange buffers are full, the producers wait. The 21 seconds are summed across threads and the wide rows mean few rows per packet, hence the 60’000 waits.
PAGEIOLATCH_SH also grew, from 41 ms to 2’237 ms. Several threads competing for pages of the same table is a plausible explanation, but I have no real proof of it.
What to take from this
For a query that reads the whole table and returns the whole table, most of the estimated cost is I/O, and the optimizer never divides I/O between threads. On Users, that left ~90 percent of the scan cost untouched by parallelism, and only the remaining CPU share, about 0.33, available to be split. Against that small saving, the parallel plan has to pay for funnelling every row through a single exchange, and on this table the exchange cost more than the plan could save. Row count does not change the outcome, since the I/O, the CPU and the exchange all grow with it.
What makes the optimizer choose a parallel plan is the estimated number of rows crossing the exchange: the forced plan got there with an integer comparison that costs nothing, simply because the estimate dropped to 45 rows. What makes a parallel plan actually faster is something else, real CPU work per row to spread across threads, and few rows coming out at the end. The LIKE query has both, which is why it wins. The forced plan had neither, and it burned almost three times the CPU.
![Thumbnail [60x60]](https://www.dbi-services.com/blog/wp-content/uploads/2025/11/LTO_WEB.jpg)
![Thumbnail [90x90]](https://www.dbi-services.com/blog/wp-content/uploads/2024/03/AHI_web.jpg)