During a recent performance review on a SQL Server 2019 instance (AlwaysOn Failover Cluster Instance, bare-metal), one number stood out. This post follows the investigation: from a latency figure in a DMV, down the I/O path to a RAID controller setting nobody had ever chosen.
The starting point: one number from a health check
The I/O statistics of the instance (sys.dm_io_virtual_file_stats) reported the following for tempdb hosted on a local volume D:
| Files | Type | Avg write latency | Writes | Acceptable threshold |
|---|---|---|---|---|
| 8 data files | ROWS | about 380 ms | About 15.8 M each | 20 ms |
| Log file | LOG | 90.6 ms | 2.2 M | 20 ms |
And the global view of the volume:
| Metric | Value |
|---|---|
| Avg read latency | 1.76 ms |
| Avg write latency | 375.91 ms |
Two details frame the whole investigation:
- Reads are excellent. Writes are 19 times over the threshold. The read path is healthy, the write path is not.
- io_stall_write_ms measures the time between I/O submission and completion, queue time included. A high average does not tell us whether each write is slow or whether writes are waiting behind each other.
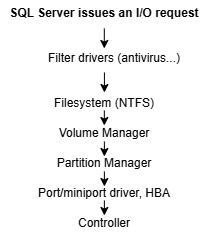
When SQL Server performs a write operation, the request goes through the following (simplified) path:
What it is not
The 8 data files show nearly identical latencies and write counts (about 15.8 M each). The tempdb round-robin allocation works perfectly. This is not a hotspot, not a single bad file. The whole volume is affected.
The volume D is local to each cluster node. It is not a shared disk (not on the storage array).
Slow media or queuing?
The DMV cannot separate service time from queue time. So we measured the service time directly at idle with WinSAT:
| Measure | I/O profile | Result | IOPS |
|---|---|---|---|
| Random read | 16 KB | 451 MB/s | About 28 900 |
| Sequential read | 64 KB | 1 965 MB/s | |
| Sequential write | 64 KB | 964 MB/s | |
| Random write | 8 KB (SQL Server page profile) | 394 MB/s | About 50 500 |
| Read latency, maximum | 3.1 ms |
The media is excellent on all four access profiles. The verdict is simple: the 380 ms are queue time, not service time.
A quick calculation confirms it. The DMV counted about 128 M writes over 104 hours of uptime: about 340 writes per second on average. The volume can absorb 50,000. Average utilization: 0.7%. A volume used at 0.7% that shows 376 ms of average latency means one thing: the load is not smooth. It arrives in bursts. During a burst, thousands of I/Os pile up in the queue, each one waits behind the others and since most of the write volume is concentrated in those bursts they dominate the average.
Where the bursts come from
On this instance, the bursts are produced by sort and hash operations that do not fit in their memory grant and spill to tempdb, mainly during data loads and some heavy analytical queries. The workload side of this story (memory grants, parallelism, NUMA topology) is covered in this blog : https://www.dbi-services.com/blog/wait-stats-and-sub-numa-clustering/
In this post, we follow the storage path only: whatever the workload does, a burst of writes should not cost 380 ms per I/O on a volume this fast.
The invisible layer
When SQL Server writes a page to tempdb, the write goes through this chain:
SQL Server > Windows/NTFS > driver (SmartPqi.sys) > Smart Array controller > physical SSDs
Windows never talks to the SSDs. It talks to the RAID controller (an HPE Smart Array P408i-a) which assembles two SAS SSDs into a RAID 1 mirror and presents the result as volume D.
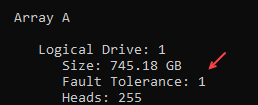
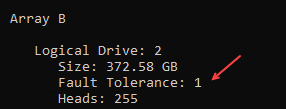
Here is the key point: every instrument used so far measures through that controller without seeing it. The DMVs measure above it. WinSAT measures above it. Only one question remains open: how is that card configured? And only one tool answers it: the Smart Storage Administrator CLI (ssacli).
Factory settings
ctrl slot=0 show detail

   Cache Board Present: True
   Total Cache Size: 2.0
   Cache Status: Not Configured
   Battery/Capacitor Status: OK
   No-Battery Write Cache: Disabled

ctrl slot=0 ld all show detail

   Logical Drive: 2          (volume D)
      Fault Tolerance: 1     (RAID 1)
      Caching: Disabled
      LD Acceleration Method: Smart Path
| Output | Value | Details |
|---|---|---|
| Cache Board Present / Total Cache Size | True / 2 GB | The controller has a write cache module (1.8 GB usable) |
| Battery/Capacitor Status | OK | Its power-loss protection is healthy |
| Cache Status | Not Configured | The cache serves no volume: it is idle |
| LD Acceleration Method (on D:) | Smart Path | The volume uses an I/O path that bypasses the cache |
| Caching (on D:) | Disabled | Confirmation at the logical drive level |
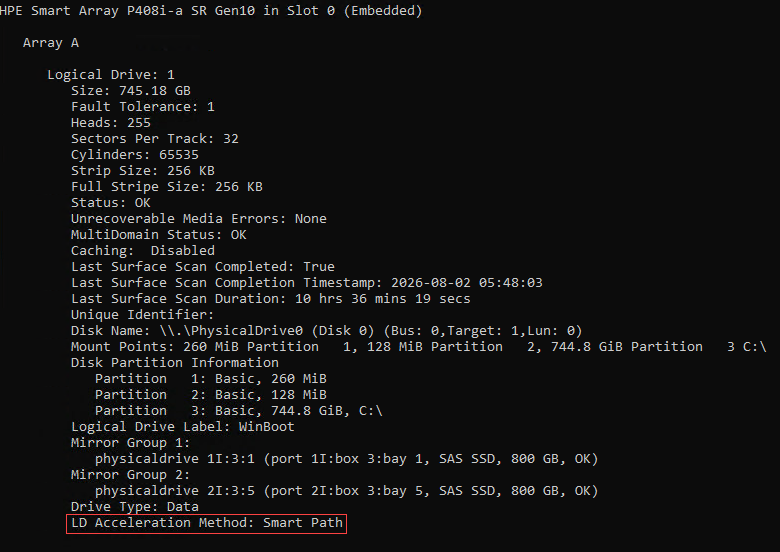
HPE SSD Smart Path is a direct I/O path: requests skip the RAID firmware stack and go straight to the SSDs. It saves a few dozen microseconds per I/O which benefits reads. But it is a per-volume switch and it is mutually exclusive with the controller cache. Smart Path is enabled by default on every SSD array (factory default). It’s reasonable for a read-oriented volume but it was never revisited for a volume hosting tempdb (one of the most write-intensive profiles there is).
The consequence: every write must be applied to both SSDs of the mirror and confirmed before it is acknowledged. There is no absorber anywhere in the chain. When a burst arrives the queue explodes.
| Today (Smart Path) | After (cache enabled) | |
|---|---|---|
| Reads | Direct path to the SSDs | Classic path (+ a few dozen microseconds) + read cache |
| Writes | Wait for both SSDs to confirm | Posted to DRAM: acknowledged in microseconds, mirror written in the background |
Is enabling the write cache safe?
The old advice “do not enable write caching” targets a different cache: the volatile DRAM inside the disks themselves which loses acknowledged writes on power failure. That one stays disabled (Drive Write Cache Policy: Disable).
The controller cache is a different story. Microsoft’s requirement is stable media: an acknowledged write must survive a power failure. This controller qualifies through the flash-backed write cache mechanism:
- On power loss, the battery does not store any data. It powers the cache module for a few seconds just long enough for the controller to copy the DRAM content to the flash NAND chip on the module itself. Flash is non-volatile: the data survives without any power (indefinitely).
- At reboot the controller restores that data and writes it to the SSDs of the volume before accepting any new I/O.
- If the battery ever fails the controller detects it and automatically falls back to write-through.
There is a second safety belt specific to this volume: tempdb is recreated at every instance startup. Even in the worst theoretical scenario, there is no data anyone would come back for.
The possible fix
Three online reversible commands:
ssacli ctrl slot=0 array B modify ssdsmartpath=disable
ssacli ctrl slot=0 ld 2 modify caching=enable
ssacli ctrl slot=0 modify cacheratio=10/90
Why cacheratio=10/90?
This setting splits the controller cache: 10% for reads, 90% for writes. It is not an exotic choice, it is the HPE factory default for a configured cache documented as the best ratio for most workloads.
Expected result: LD Acceleration Method: Controller Cache on the logical drive, Cache Status: OK on the controller.
To validate we should not rely on the cumulative DMV averages they will stay polluted by history. We should measure deltas:
- WinSAT after the change: service time should stay excellent (nothing was broken).
- sys.dm_io_virtual_file_stats deltas over a defined window covering the load phases.
- PerfMon during the load window: Avg. Disk sec/Write should stay in single digits at the peak of a burst and the queue should drain between bursts.
One expectation to set correctly: the cache absorbs bursts but it does not add throughput. All the bytes still land on the same two SSDs.
Note: these commands have not been implemented. They are proposals only. The change must be reviewed, validated and scheduled by the customer before any implementation.
Local tempdb volumes on FCI nodes: a good idea
Placing tempdb on a local volume in a Failover Cluster Instance is supported since SQL Server 2012 and it is a good design: tempdb is recreated at startup so there is nothing to fail over. It offloads the shared storage and local SSDs deliver excellent performance for one of the hottest write profiles of the instance (our measurements above prove it).
But this choice turns storage health into a per-node responsibility:
- Check the RAID controller configuration on every node. The passive node most likely carries the same factory default. After a failover the problem would silently come back.
- Monitor Battery/Capacitor Status. A dead battery silently disables the write cache and brings the symptom back.
The architecture is right. It just makes your RAID controller part of your database health check.
Thank you. Amine Haloui
![Thumbnail [60x60]](https://www.dbi-services.com/blog/wp-content/uploads/2024/03/AHI_web.jpg)
![Thumbnail [90x90]](https://www.dbi-services.com/blog/wp-content/uploads/2022/08/STH_web-min-scaled.jpg)
![Thumbnail [90x90]](https://www.dbi-services.com/blog/wp-content/uploads/2025/11/LTO_WEB.jpg)
Steven N
15.08.2026Great stuff, once again !