Cumulative Update 5 for SQL Server 2025 was released on May 20, 2026 (build 17.0.4045.5). Seven entries in the KB, mostly fixes. One of them is not a fix: it is a new server configuration option, max lock manager cache memory (%).

Reference: https://support.microsoft.com/en-us/servicing/sql/sql-server-2025/cumulative-update/kb5084896-cu5
I built a lab on CU5 and on later builds up to CU9 and I spent some time measuring. Most of the documentation is confirmed. The sentence that says what the option actually changes, is not: on my lab, under the conditions described below I could not reproduce it. This post is what I measured with the protocol so that you can run it yourself and tell me if you get something different.
Why would released locks still cost memory?
A lock is not one structure in memory, it is two. The lock block describes the locked resource: this row, this page, this table. The lock owner block describes who holds it and in which mode. Three sessions reading the same row give one lock block and three lock owner blocks. sys.dm_tran_locks returns one row per owner block: the resource_* columns describe the lock block, the request_* columns the owner block and lock_owner_address is literally its address in memory.
The documentation gives 96 bytes per lock: 64 bytes for the lock block, plus 32 bytes per owner block. On my lab, a row lock costs about 195 bytes all included, the clerk’s pages divided by the number of locks held: twice the documented figure. I did not dig into where the other 100 bytes go (object store overhead, 64-bit structures, alignment). Keep 200 bytes in mind. Ten million row locks are 2 GB.
These structures are not database pages. They are stolen memory taken from a pool owned by the lock manager. This pool is visible as the OBJECTSTORE_LOCK_MANAGER memory clerk in sys.dm_os_memory_clerks (one clerk per NUMA node, named Lock Manager : Node 0…) and as the Lock Memory (KB) performance counter. The locks documentation says 2500 lock structures. On my lab, Lock Blocks Allocated reports 3050 right after a restart, on SQL Server 2022 as on 2025.

Here is what I have :
SELECT
    cntr_value AS lock_blocks_allocated
FROM sys.dm_os_performance_counters
WHERE object_name LIKE N'%:Memory Manager%'
  AND counter_name = N'Lock Blocks Allocated';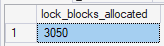
Now the important part. When a transaction commits or rolls back, its locks are released. The lock structures are not returned to SQLOS. They stay in the pool, ready to be reused by the next lock request. This is a cache and the reason is simple: allocating memory for every lock acquisition would be expensive and lock acquisition is on the hot path of every query.
The numbers to remember
Four numbers. The documentation expresses the percentages against the “SQLOS committed memory”. On my lab, they behave as percentages of committed_target_kb in sys.dm_os_sys_info, the Target Server Memory (KB) counter: what SQLOS is allowed to use, not what it has used so far. Test 1 below shows why I say so.
| Threshold | Value | What happens |
| Lock escalation per statement | 5000 locks on one table or partition | The row and page locks of the statement are replaced by one table (or partition) lock |
| Lock escalation, memory | 24 % of the engine memory (40 % of the lock memory limit) | The engine picks active statements and escalates their locks, every 1,250 new locks as long as lock memory stays above the threshold |
| Lock memory limit | 60 % of the target | No more lock structures can be allocated: error 1204, the statement fails and the transaction is rolled back |
| Lock manager cache limit (new in CU5) | 20 % of the target by default, 20 to 60 allowed | The cached structures should fit under this size. Whether and when that is enforced is the subject of this post |
Two remarks. Lock escalation exists precisely to keep lock memory small: 5000 row locks cost about 1 MB, one table lock costs 200 bytes. And the 60 % limit is not a cache limit: it is the maximum memory the lock manager may use, cache included.
What was the problem before CU5?
The cache could grow up to the 60 % limit. It was given back slowly, by a background task and that task could be slow enough for the cache to look permanent.
The typical trigger is a workload that acquires a very large number of locks at once. The documentation mentions large concurrent query workloads with lock escalation disabled at the instance level (trace flag 1211). But you do not need a trace flag for that. ALTER TABLE … SET (LOCK_ESCALATION = DISABLE) on a big table, a reporting query in REPEATABLE READ or SERIALIZABLE scanning millions of rows, a purge that could not escalate because another session held an incompatible lock on the table: any of these can push lock memory to several GB.
After the transaction ends, the lock structures stay in the cache. The buffer pool, the plan cache and every other cache have to live with what is left. Page life expectancy drops, physical reads increase, and nothing in the current workload explains it, because the workload that caused it is over.
The symptom is easy to recognize once you know it. An idle instance, sys.dm_tran_locks almost empty and OBJECTSTORE_LOCK_MANAGER reporting GB. On an instance with a 128 GB target, the cache can hold up to about 77 GB.
What the documentation says CU5 changes
The lock manager cache now has a ceiling and you can configure it:
EXECUTE sp_configure 'show advanced options', 1;
RECONFIGURE;

EXECUTE sp_configure 'max lock manager cache memory (%)', 20;
RECONFIGURE;
The server must be restarted before the setting can take effect. The Server configuration options page lists it as A, RR (advanced, restart required): https://learn.microsoft.com/en-us/sql/database-engine/configure-windows/server-configuration-options-sql-server?view=sql-server-ver17
What the option limits is the cache, not the locks.
As stated in the documentation:
Lock manager memory can still grow up to 60 percent of the SQLOS committed memory if required by the workload. However, when locks are released, memory is freed rather than cached if the lock manager cache already reached its configured limit.
It says two things. A transaction may still take up to 60 % of the memory in locks: true (test 1). And when locks are released while the cache is already at its limit, the memory is freed instead of cached: this is the sentence I could not reproduce (tests 2 and 3).
The probe
;WITH lm AS
(
    SELECT SUM(pages_kb) AS lock_manager_kb
    FROM sys.dm_os_memory_clerks
    WHERE type = N'OBJECTSTORE_LOCK_MANAGER'
),
si AS
(
    SELECT committed_kb, committed_target_kb
    FROM sys.dm_os_sys_info
),
pc AS
(
    SELECT
        MAX(CASE WHEN counter_name = N'Lock Blocks'                THEN cntr_value END) AS lock_blocks_in_use,
        MAX(CASE WHEN counter_name = N'Lock Blocks Allocated'      THEN cntr_value END) AS lock_blocks_allocated,
        MAX(CASE WHEN counter_name = N'Lock Memory (KB)'           THEN cntr_value END) AS lock_memory_kb,
        MAX(CASE WHEN counter_name = N'Database Cache Memory (KB)' THEN cntr_value END) AS database_cache_kb,
        MAX(CASE WHEN counter_name = N'Free Memory (KB)'           THEN cntr_value END) AS free_memory_kb
    FROM sys.dm_os_performance_counters
    WHERE object_name LIKE N'%Memory Manager%'
)
SELECT
    SYSDATETIME()  AS measured_at,
    lm.lock_manager_kb / 1024  AS lock_manager_mb,
    si.committed_kb / 1024  AS committed_mb,
    si.committed_target_kb / 1024 AS target_mb,
    CAST(100.0 * lm.lock_manager_kb / si.committed_target_kb AS DECIMAL(5, 1)) AS lock_manager_pct,
    pc.lock_blocks_in_use,
    pc.lock_blocks_allocated,
    pc.lock_blocks_allocated - pc.lock_blocks_in_use AS lock_blocks_cached,
    pc.database_cache_kb / 1024 AS buffer_pool_mb,
    pc.free_memory_kb / 1024 AS free_mb
FROM lm
CROSS JOIN si
CROSS JOIN pc;
How to read it:
- lock_manager_mb is the whole lock manager memory: locks in use plus cached structures. On an idle instance, it is the size of the cache. This is the measure that matters.
- committed_mb is what SQLOS has taken from the operating system so far. target_mb is what it is allowed to take. On an instance that has been running for a while, the two are equal. On a freshly restarted lab, they are far apart and nothing in the percentages makes sense until they meet.
- lock_manager_pct is the clerk against the target. The 20 % and the 60 % are read on this column.
- buffer_pool_mb and free_mb show who pays for the cache, and who gets the memory back.
- lock_blocks_in_use, lock_blocks_allocated and their difference lock_blocks_cached are the performance counters on lock blocks. They are coherent on a freshly started instance (3050 allocated, 0 in use) and stop refreshing after a lock storm on every 2025 build I tested: 6 624 047 allocated blocks reported while the clerk held 1 MB. They are here so that you can see it. Do not use them as evidence, sys.dm_tran_locks is the truth for locks held, the clerk for memory.

The lab
SQL Server 2025 Developer Edition, CU5 (17.0.4045.5) first, then CU9 (17.0.5005.3), on virtual machines of a Proxmox lab and on a Nutanix environment. One SQL Server 2022 instance for comparison, in test 5. The SQLOS target is 4096 MB unless stated otherwise (2048 MB in test 4), with min server memory and max server memory pinned to the same value.
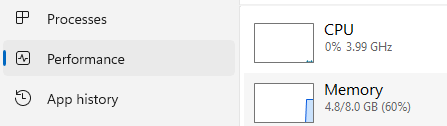
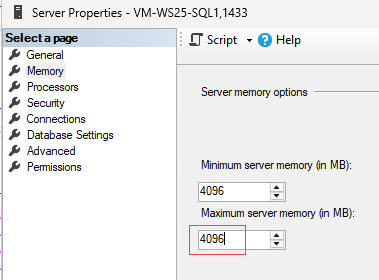
A database with one narrow table. Lock escalation is disabled on the table: we want millions of row locks, not one table lock. This is the scenario the documentation describes at table level instead of trace flag 1211:
CREATE DATABASE LockCacheDemo
GO
ALTER DATABASE LockCacheDemo SET RECOVERY SIMPLE
GO
USE LockCacheDemo
GO
CREATE TABLE dbo.T_Locks
(
    id     INT      NOT NULL,
    filler CHAR(20) NOT NULL CONSTRAINT DF_T_Locks_filler DEFAULT ('x'),
    CONSTRAINT PK_T_Locks PRIMARY KEY CLUSTERED (id)
)
GO
INSERT INTO dbo.T_Locks WITH (TABLOCK) (id)
SELECT value
FROM GENERATE_SERIES(1, 30000000)
GO
ALTER TABLE dbo.T_Locks SET (LOCK_ESCALATION = DISABLE)
GO
Thirty million rows, about 1 GB. Nothing in this block touches the lock manager: the TABLOCK on the insert takes one table lock to load fast. This block only provides lockable rows and removes the mechanism that would stop us from locking them one by one.
The workload (session A):
USE LockCacheDemo
GO
SET TRANSACTION ISOLATION LEVEL REPEATABLE READ
GO
DECLARE @rows INT = 1000000;

BEGIN TRANSACTION

SELECT COUNT(*) AS rows_locked
FROM (
    SELECT TOP (@rows) id
    FROM dbo.T_Locks WITH (ROWLOCK)
    ORDER BY id
) AS x

-- Leave the transaction open. Measure from session B. Then:
-- ROLLBACK TRANSACTION
Three different settings:
| Setting | Why |
| LOCK_ESCALATION = DISABLE on the table | Keeps SQL Server from swapping the row locks for one table lock at 5000 locks. |
| WITH (ROWLOCK) | One lock per row. Otherwise SQL Server may lock pages: one lock for 245 rows. |
| REPEATABLE READ | Every shared lock is kept until the end of the transaction. In READ COMMITTED it is released as soon as the row is read. |
From a second session (session B): did we get row locks and did escalation stay out?
SELECT resource_type, request_mode, COUNT(*) AS lock_count
FROM sys.dm_tran_locks
WHERE request_session_id = 65   -- The session holding the locks
GROUP BY resource_type, request_mode
ORDER BY lock_count DESC;
| resource_type | request_mode | lock_count |
| KEY | S | 1 000 000 |
| PAGE | IS | 4 082 |
| OBJECT | IS | 1 |
| DATABASE | S | 1 |
One shared lock per row (KEY, the row of a clustered index). One intent lock per page, about 245 rows per page. One intent lock on the table and no OBJECT S: no escalation.
Second check, the cost of a lock. Measured on a restarted instance each time so that nothing was cached before the run:
DECLARE @spid    INT    = 65;  -- session A
DECLARE @idle_kb BIGINT = 0;   -- clerk before the transaction

SELECT
    l.lock_count,
    l.key_locks,
    c.lock_manager_kb / 1024                                  AS lock_manager_mb,
    (c.lock_manager_kb - @idle_kb) * 1024.0 / l.lock_count    AS bytes_per_structure,
    (c.lock_manager_kb - @idle_kb) * 1024.0 / l.key_locks     AS bytes_per_row_lock
FROM (
    SELECT COUNT_BIG(*)                                            AS lock_count,
           SUM(CASE WHEN resource_type = N'KEY' THEN 1 ELSE 0 END) AS key_locks
    FROM sys.dm_tran_locks
    WHERE request_session_id = @spid
) AS l
CROSS JOIN (
    SELECT SUM(pages_kb) AS lock_manager_kb
    FROM sys.dm_os_memory_clerks
    WHERE type = N'OBJECTSTORE_LOCK_MANAGER'
) AS c;| Rows locked | lock_manager_mb | Bytes per row lock |
| 1 000 000 | 187 | 196 |
| 5 000 000 | 932 | 195 |
| 6 000 000 | 1 117 | 195 |
| 9 000 000 | 1 677 | 195 |
For example :


Four runs, the same figure: about 195 bytes per row lock, everything included. Twice the 96 bytes of the documentation (64 for the lock block, 32 per owner block).
Test 1: The 60 % wall has not moved
The name of the option invites a misunderstanding: it is not a limit on locks. Option at its default of 20 and @rows = 70 000 000 far beyond what 60 % of the target can hold (Target at 4968 MB for this run). The lock manager climbs.

The probe shows 20 %, then 24 % without any escalation (the table option prevents it), then 40 %, 50 % and the statement dies:
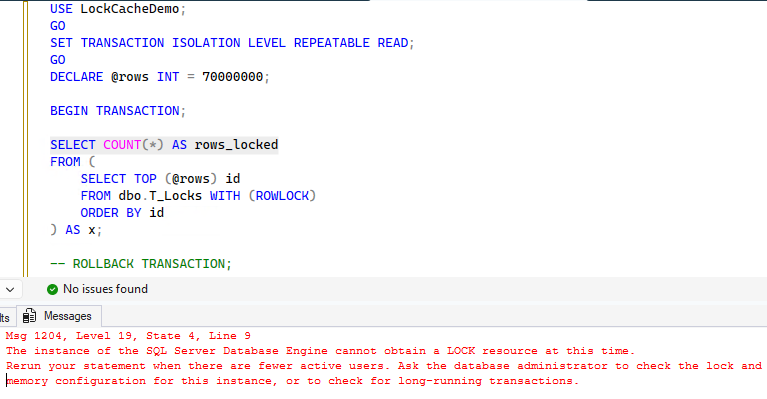
Severity 19: the statement is terminated and the transaction is rolled back. The same message lands in the SQL Server error log and in the Windows application log.
This test also settled which memory figure the percentages refer to. On the last probe before the error, the clerk was at 2979 MB: 60 % of the 4968 MB target, and 70 % of the 4233 MB SQLOS had committed at that moment. A 60 % limit on the committed memory would have fired about 440 MB earlier, at 2540 MB. The 60 % limit, and with it the 20 % one, are percentages of the target, not of the memory committed so far. This is why the probe divides by committed_target_kb.
Test 2: Releasing the locks frees nothing
This is the test I wrote this post for. Option at 20. Target at 4096 MB for this run, so the cache ceiling is 819 MB. Nine million locks:
| Step | lock_manager_mb | lock_manager_pct | committed_mb | buffer_pool_mb |
| Idle, after restart | 0 | 0.0 | 285 | 27 |
| 9 000 000 locks held | 1 677 | 40.9 | 2 296 | 349 |
| ROLLBACK, a few seconds later | 1 677 | 40.9 | 2 296 | 349 |
| ROLLBACK, minutes later | 1 677 | 40.9 | 2 296 | 349 |
buffer_pool_mb is the Database Cache Memory (KB) counter: the data and index pages in memory. The 349 MB are the pages of the nine million rows the SELECT had to read to lock them, nothing else touched the buffer pool. sys.dm_tran_locks is empty, the session holds nothing and the clerk has not moved. 1677 MB of lock structures are sitting in the cache, twice the configured ceiling. The ROLLBACK did not free anything and neither did the minutes after it.

I ran this on CU5 and on CU9, with 5, 6, 9 and 12 million locks with targets of 2 048 and 4 096 MB. Same result every time. The last run, 12 million locks on CU9 left 2193 MB in the cache, 54 % of the target and they were still there hours later.
Test 3: Later transactions free nothing either
There is a second way to read the sentence of the documentation. Not the release of the storm but the releases that follow: once the cache is above its limit, every structure released by a later transaction should be freed instead of cached and the cache would erode with the lock activity of the workload, down to 20 %. “Large concurrent query workloads” as the documentation puts it.
A first attempt with UPDATE TOP (1000000) … SET filler = ‘y’ and a COMMIT, repeated, lowered the clerk by a few MB per pass. Not conclusive: without a ROWLOCK hint, the engine is free to take page locks for an update of this size and then only a few thousand structures travel through the cache at each pass.
So the proper version, with row locks guaranteed and verified. Cache at 40.9 % of the target after a storm, option at 20, and short transactions in a loop:
USE LockCacheDemo
GO

SET NOCOUNT ON;
SET TRANSACTION ISOLATION LEVEL REPEATABLE READ;

DECLARE @i INT = 0, @n INT;

WHILE @i < 100
BEGIN
    BEGIN TRANSACTION;
    SELECT @n = COUNT(*)
    FROM (SELECT TOP (200000) id
          FROM dbo.T_Locks WITH (ROWLOCK)
          WHERE id > (@i % 50) * 200000
          ORDER BY id) AS x;
    COMMIT;            -- 200 000 structures released
    SET @i += 1;
END
One hundred transactions, 200,000 row locks each, verified in sys.dm_tran_locks while the loop ran: twenty million lock releases, more than four times the 4.6 million structures sitting above the ceiling (858 MB).
| Step | lock_manager_mb | lock_manager_pct |
| Before the loop | 1 677 | 40.9 |
| After 20 000 000 releases | 1 677 | 40.9 |
The clerk did not move. Twenty million releases while the cache was more than twice its limit and the memory stayed. Whatever “when locks are released, memory is freed rather than cached” describes, it is not something I can observe with row locks, on CU5 or CU9, with the option at its default.
Test 4: What does shrink the cache
Two things did, during the week. None of them is the sentence of the documentation. Memory demand, once. Target at 2 048 MB, option at 20, six million locks, ROLLBACK: 1 117 MB in the cache, 54.6 %. Then a NOLOCK scan of a 17 GB table which takes one schema stability lock and nothing else but needs every page in the buffer pool:
| Step | lock_manager_mb | lock_manager_pct | committed_mb | target_mb | buffer_pool_mb |
| 6 000 000 locks held | 1 117 | 54.6 | 1 549 | 2 048 | 203 |
| After ROLLBACK | 1 117 | 54.6 | 1 549 | 2 048 | 203 |
| After the NOLOCK scan | 332 | 16.2 | 2 048 | 2 048 | 1 408 |
The scan pushed committed_mb up to the target at that moment the buffer pool still wanted pages, SQLOS had nothing left to take from the operating system and it took from the lock manager: 785 MB given back, the clerk under the ceiling. Not one lock released in between. That looked like the mechanism. It was not reproducible either: on CU9 with the cache at 2 193 MB and the instance already at its 4 096 MB target, the same 17 GB scan left the cache at 2 190 MB. sys.dm_os_ring_buffers tells why: the memory broker that governs the lock manager cache (MEMORYBROKER_FOR_CACHE, which is where the object store lives, not MEMORYBROKER_FOR_STEAL) kept sending it a target of 2 809 MB, 68 % of the target with SHRINK notifications of a few MB. There is no 20 % anywhere in the broker’s arithmetic.
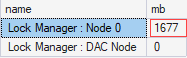
DBCC FREESYSTEMCACHE, instantly. The documentation only shows ‘ALL’, which releases the unused entries of every cache, plan cache included, at the price of recompiling every plan afterwards. It also says that most caches can be freed individually. The lock manager cache is one of them:
SELECT name, pages_kb / 1024 AS mb
FROM sys.dm_os_memory_clerks
WHERE name LIKE N'Lock Manager%';

DBCC FREESYSTEMCACHE('Lock Manager : Node 0');
Before :
After :
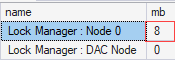
Probe right after, on the 1677 MB cache left by test 3: 8 MB in the clerk, and the memory back in free_mb. The cache is releasable at any time in one instruction. What is missing on these builds is not the ability to release it, it is the trigger.
Test 5: SQL Server 2022 does the same without the option
If the option changed something, the comparison with a version that does not have it should show it. Same table, same workload, @rows = 70000000 for the wall and a value under the wall for the clean ROLLBACK, on SQL Server 2022 and on SQL Server 2025 CU5, CU9 with the option at 20:
| Scenario | SQL Server 2022 | SQL Server 2025 CU5, CU9, option at 20 |
| Locks acquired below the wall then ROLLBACK | Memory given back progressively, down to 17.6 % | Memory given back very progressively |
| 60 % wall, error 1204 | Memory given back very progressively | Descent very, very slow, then stagnation |
Two things in this table. The background release exists on 2022, without any option, and it brings the cache down to 17.6 %, which is where the 20 % ceiling of 2025 would put it. And 2025 is not faster than 2022 at giving the memory back.
What the tests say
Put together, on SQL Server 2025 CU5 and CU9 with one big transaction and then normal lock activity:
- Lock memory, cache included, can grow up to 60 % of the target. Beyond that, error 1204. Confirmed and unchanged by the option.
- When the storm is released, nothing is freed. The structures go to the cache above the configured ceiling and stay there for hours.
- The lock activity that follows does not free them either: twenty million row-lock releases above the ceiling, no measurable change.
- The cache does come down, slowly, through the generic SQLOS mechanisms (background release, memory broker rebalancing when the instance is at its target), the same ones SQL Server 2022 has. On 2025, they are not faster, and the 20 % figure does not appear in the broker’s targets.
- DBCC FREESYSTEMCACHE(‘Lock Manager : Node N’) empties the cache immediately on any version I tried.
So the documented behavior, “when locks are released, memory is freed rather than cached if the lock manager cache already reached its configured limit”, is not something I could reproduce. Not on CU5, not on CU9, not with the release of the big transaction, not with twenty million releases afterwards. The option is there, it accepts 20 to 60, value_in_use says 20 and the cache sits around 40% for as long as I care to watch.
Two caveats, because this is a lab and not a support case. One access pattern: a single transaction holding millions of row locks then released. Virtual machines with 2 and 4 GB targets. Developer Edition. It is possible that the mechanism needs a condition I did not create and that “large concurrent query workloads” means something more specific than what I ran. If you reproduce the protocol above and see the cache come back under 20 % after a release, I want to hear about it. If you do not, you have the same question I have.
A summary
- Released locks are not freed, they are cached by the lock manager. A row lock costs about 195 bytes all included.
- The thresholds (24 % escalation, 60 % hard limit, 20 % cache ceiling) are read against committed_target_kb, not committed_kb. On a lab, set min and max server memory before measuring anything.
- CU5 adds max lock manager cache memory (%): 20 by default, 20 to 60 allowed, a restart to take effect (is_dynamic = 0).
- The 60 % wall and error 1204 are unchanged by the option.
- On CU5 and CU9, releasing the locks does not bring the cache back under the ceiling and neither do twenty million later releases. The documented behavior was not reproducible on my lab.
- The cache does shrink through the generic SQLOS mechanisms slowly as on SQL Server 2022 and the memory broker targets it well above 20 %.
- DBCC FREESYSTEMCACHE(‘Lock Manager : Node N’) empties it instantly (on any version I tried). It is the remedy that works.
- The lock block performance counters stop refreshing on these builds. Use the clerk and sys.dm_tran_locks.
![Thumbnail [60x60]](https://www.dbi-services.com/blog/wp-content/uploads/2024/03/AHI_web.jpg)
![Thumbnail [90x90]](https://www.dbi-services.com/blog/wp-content/uploads/2025/11/LTO_WEB.jpg)
![Thumbnail [90x90]](https://www.dbi-services.com/blog/wp-content/uploads/2025/05/martin_bracher_2048x1536.jpg)