As engineers, we’ve all built dashboards, tuned alerts, and fought noisy monitoring systems. Tools like Elastic, Prometheus, Grafana, Zabbix, or Nagios have shaped how we operate infrastructure for years.
Yet modern distributed systems introduced a shift in mindset: monitoring is no longer enough. Enter observability, not as a buzzword, but as an operational necessity.
This blog explains the difference clearly, with practical engineering examples and a real-world perspective.
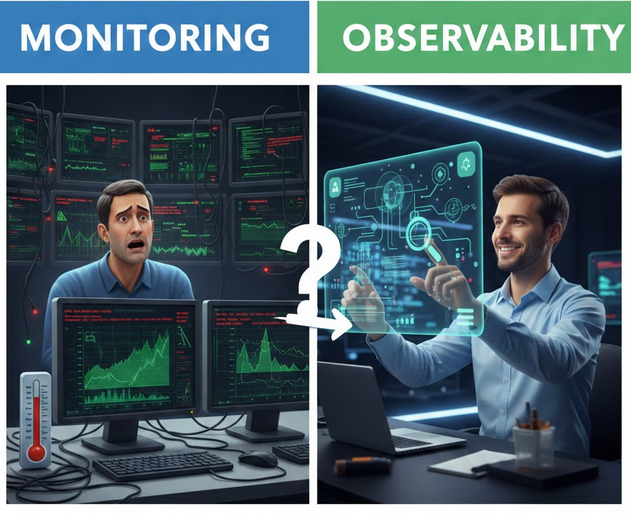
Monitoring: Knowing When Something Is Wrong
Traditional monitoring answers a very specific set of questions:
- Is the service up?
- Are resources within acceptable limits?
- Are error rates crossing thresholds?
- Are we respecting SLAs?
Monitoring is fundamentally about predefined signals.
What Monitoring Does Well
Monitoring excels at:
- Incident detection
- Alerting and operational response
- Capacity tracking and trend analysis
- Infrastructure health visibility
Example: Classic Monitoring Workflow
You monitor an API using:
- Prometheus metrics (
http_requests_total, latency histograms) - Grafana dashboards
- Alert rule: 5xx error rate > 2% for 5 minutes
You immediately know something is wrong. But the next question appears: Why is it wrong?
And this is where traditional monitoring starts to hit limits.
The core limitation
Monitoring depends on:
- Metrics you anticipated
- Thresholds you defined in advance
- Scenarios you already imagined
When failures fall outside those assumptions, which is common in distributed systems, troubleshooting becomes exploratory and slow.
Observability: Understanding Why Something Is Wrong
Observability is not just more dashboards. It is the ability to understand internal system behavior from external outputs, even when you don’t already know what to look for.
Instead of asking: “Is the system healthy?”
Observability lets you ask:
- Why are users experiencing latency?
- Which service introduced the regression?
- What changed right before the incident?
- Which request path is affected?
This is a fundamentally different operational capability.
Modern observability relies on correlated telemetry:
- Metrics – aggregated system behavior
- Logs – detailed contextual events
- Traces – end-to-end request journeys
Individually, they are useful. Together, they provide causal understanding.
Practical Evolution: From Monitoring to Observability
You don’t replace monitoring, you evolve it. A pragmatic path:
- Define meaningful metrics
Focus on user-centric signals: latency, traffic, errors, saturation. - Structure logs properly
Include fields likeservice,environment,trace_id,deployment_version. - Instrument distributed tracing
Start with critical journeys (checkout, authentication, search). - Enable cross-linking
Alert -> metric -> trace -> logs must be one flow. - Shift toward SLO-based thinking
Alert on user impact, not raw CPU.
Conclusion
Observability isn’t about collecting more data, it’s about turning telemetry into understanding.
And that is where mature engineering organizations truly differentiate themselves: not by how much they monitor, but by how quickly and confidently they can understand, diagnose, and resolve complex system behaviors in production.
If your organization is starting this journey or aiming to accelerate its maturity, we would be happy to help. From strategy and tooling selection to implementation and operational enablement, feel free to reach out and connect with us.
Related blogs : Zabbix, monitoring, Elastic
![Thumbnail [60x60]](https://www.dbi-services.com/blog/wp-content/uploads/2022/09/DDI_web-min-scaled.jpg)
![Thumbnail [90x90]](https://www.dbi-services.com/blog/wp-content/uploads/2023/01/APY_web-scaled.jpg)