As I went through many monitoring tools recently, I found that Prometheus is a de facto standard. At least from the way it is working. It is even a so strong standard that other Time Series Database (TSDB), like VictoriaMetrics, have same API interfaces. As VictoriaMetrics claims it, it is more storage and memory efficient.
Avalanche of Metrics
My first test will focus on memory efficiency. For that, I will use avalanche which allows to generate lots of metrics with few hosts. Let’s create a dashboard in Grafana as it can query Prometheus of VictoriaMetrics indifferently. I choose the following metrics which exist for both self-monitoring exporter (aka. meta-monitoring):
- go_memstats_alloc_bytes
- process_resident_memory_bytes
Then, I declared 4 targets pointing to avalanche containers and started them.
After 35 minutes, dashboard looks like this:
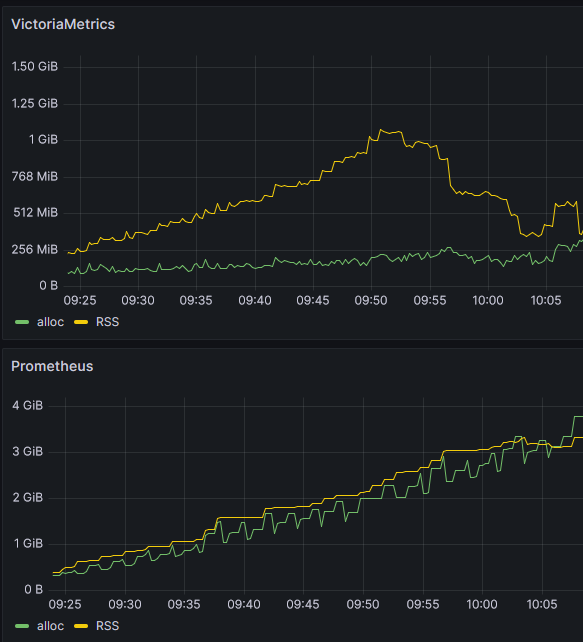
As you can see, VictoriaMetrics consume at most 1GB memory and Prometheus continuously increases. It was even killed by Out-Of-Memory Killer (probably because it is not alone on server):
Out of memory: Killed process 4061 (prometheus) total-vm:5343368kB, anon-rss:3642424kB, file-rss:0kB, shmem-rss:0kB, UID:65534 pgtables:8624kB oom_score_adj:0
Comparing storage is not showing what I was hoping:
- For Prometheus:
$ du -sh /prometheus/*
11.8M   /prometheus/chunks_head
0       /prometheus/lock
20.0K   /prometheus/queries.active
158.5M  /prometheus/wal
- VictoriaMetrics:
$ du -sh /victoria-metrics-data/*
89.7M   /victoria-metrics-data/cache
162.9M  /victoria-metrics-data/data
0       /victoria-metrics-data/flock.lock
288.8M  /victoria-metrics-data/indexdb
0       /victoria-metrics-data/metadata
4.0K    /victoria-metrics-data/prometheus.yml
0       /victoria-metrics-data/snapshots
0       /victoria-metrics-data/tmp
Despite what I was expecting, VictoriaMetrics uses more disk space than Prometheus.
At this stage, I was not very satisfied with this setup, so I decided to deploy an infrastructure on the cloud (with YaK of course):
- 1 host for Prometheus
- 1 host for Victoria-Metrics
- 1 host for Avalanche
Only Grafana will stay in my WSL setup.
Going to the Cloud
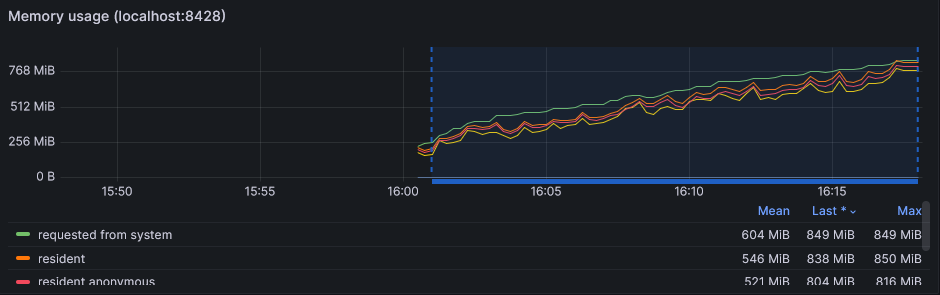
I imported the official VictoriaMetrics dashboard which includes lots of interesting panels. For example, I can see that memory related panel matches why is in my own dashboard:
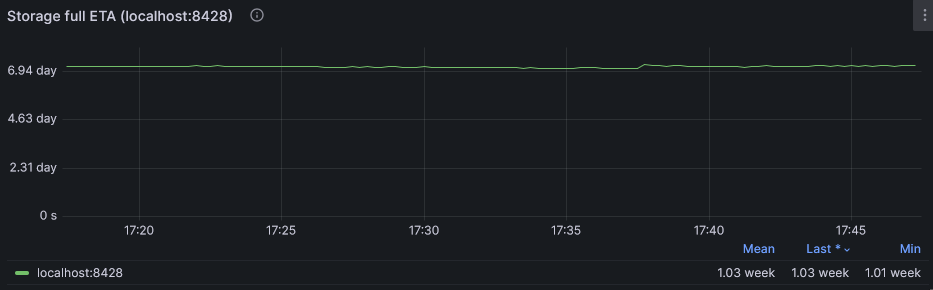
This dashboard even displays capacity planning showing an estimate of when partition will be full:
Storage
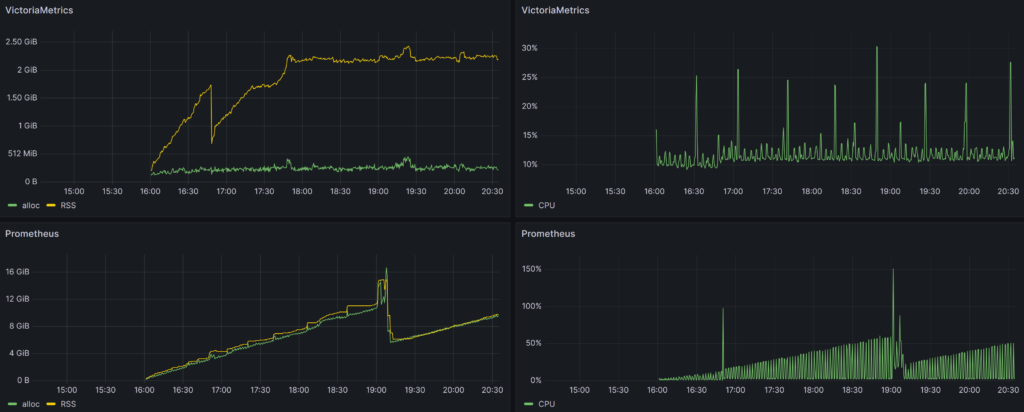
After an uptime of 2h, VictoriaMetrics finally show his superiority on storage as well:
- Prometheus (1.8 Gb total)
$ du -sh data
1.8G    data
du -sh data/*
1.3G    data/01H28TE1546ESM6Z8R66NW1JXX
8.1M    data/chunks_head
0       data/lock
20K     data/queries.active
593M    data/wal
- VictoriaMetrics (1.2 Gb total)
$ du -sh /victoria-metrics-data/
1.2G    /victoria-metrics-data/
$ du -sh /victoria-metrics-data/*
76.7M   /victoria-metrics-data/cache
472.3M  /victoria-metrics-data/data
0       /victoria-metrics-data/flock.lock
731.3M  /victoria-metrics-data/indexdb
4.0K    /victoria-metrics-data/metadata
0       /victoria-metrics-data/snapshots
0       /victoria-metrics-data/tmp
CPU
Concerning CPU, I first had a look at a simple load average as I did not want to add even more load by adding monitoring over monitoring (MoM):
- Prometheus:
load average: 0.02, 1.31, 1.38 - VictoriaMetrics:
load average: 0.02, 0.04, 0.04
Then, I found that both tools are gathering CPU metric process_cpu_seconds_total. As it is a counter (ie. cumulative), I need to apply a rate and as virtual machines have multiple cores, I must sum up result. This gives the following PromQL query:
sum by (cpu) (rate(process_cpu_seconds_total[$__rate_interval]))
Summary
To summarize, based on my experiments:
- VictoriaMetrics is limiting his memory usage compared to Prometheus which fill in host memory (Even if I consider free memory as lost memory)
- VictoriaMetrics is almost invisible in regard to CPU usage
- Concerning storage, difference is increase as time passes
In fine, VictoriaMetrics is consuming less resources.
I did not focus on query performances, but that could be another blog post.
![Thumbnail [60x60]](https://www.dbi-services.com/blog/wp-content/uploads/2022/08/OLS_web-min-scaled.jpg)
![Thumbnail [90x90]](https://www.dbi-services.com/blog/wp-content/uploads/2022/08/ENB_web-min-scaled.jpg)