With the way Prometheus is gathering metrics, pull, it is not possible to get metrics from short living processes like batch jobs as:
- batch jobs can be shorter than
scrap_interval - batch timings and
scrap_intervalare not aligned
In this blog, I will explain how to bypass this limitation with two possibles solutions: The Textfile Collector and push gateway.
Textfile Collector
Promotheus node_exporter can parse files and expose results on export page. For that, we need to indicate to node_exporter which directory to parse by adding --collector.textfile.directory at startup command. For example:
./node_exporter --collector.textfile.directory /root/batch_results/
node_exporter will parse all files with .prom extension. To avoid any access concurrency issue to the file, our batch script must write result in a temporary file and move it to a .prom file at very last step.
To start simple, I will just write current timestamp in the file my_script_end_time.prom ended with a uniq number like process id (ie. $$):
echo my_script_end_time $(date +%s) > my_script_end_time.prom.$$
This will create a file named my_script_end_time.prom.36636 with following content:
my_script_end_time 1685025635
Next, for node exporter to parse it, I must remove the extra dot and PID with:
mv my_script_end_time.prom.36636 my_script_end_time.prom
As soon as I do that, timing will be visible on node exporter (ie. http://server:9100):
$ curl -s "http://localhost:9100/metrics" | grep -n my_script
109:# HELP my_script_end_time Metric read from /root/batch_results/my_script_end_time.prom
110:# TYPE my_script_end_time untyped
111:my_script_end_time 1.685025635e+09
1041:node_textfile_mtime_seconds{file="/root/batch_results/my_script_end_time.prom"} 1.685025635e+09
Note that:
- The last line indicates which file has been parsed and when it was last modified.
- Metric has no type. This could be changed by adding a line before (ie.
# TYPE my_script_end_time counter)
With such a simple method, it is easy to instrument any script (with any scripting language) as it is just a writing into a file.
Push Gateway
Prometheus documentation state that there is limitation on using a gateway and one valid use case:
Usually, the only valid use case for the Pushgateway is for capturing the outcome of a service-level batch job.
Promotheus documentation: When to use the push gateway
Push gateway is a process which is somehow caching data for scrapper to have time to get metrics, thus it is as easy as adding any other Prometheus target. Next, we can try to “push” data into the gateway with a curl command:
cat <<EOF | curl --data-binary @- http://<pushGW>:9091/metrics/job/my_job/instance/my_instance
# TYPE my_metric gauge
# HELP my_metric Processed Records
my_metric 12345
EOF
Empty feedback and going back to prompt means it is ok. We can verify immediately with a curl command as well:
$ curl -s http://<pushGW>:9091/metrics | grep my_
# HELP my_metric Processed Records
# TYPE my_metric gauge
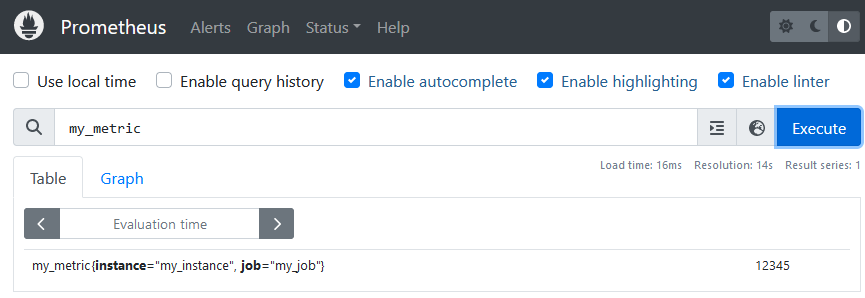
my_metric{instance="my_instance",job="my_job"} 12345
push_failure_time_seconds{instance="my_instance",job="my_job"} 0
push_time_seconds{instance="my_instance",job="my_job"} 1.6850300553978374e+09
job and instance labels are reserved labels and thus will be renamed by Prometheus to exported_job and exported_instance. Prometheus will set instance to the push gateway host and port which is not convenient when push gateway is used by multiple hosts and/or batches. To preserve instance and job labels, we must add a parameter to prometheus.yml:
  - job_name: 'pushgateway'
    static_configs:
    - targets: ['<pushGW>:9091']
    honor_labels: true
Finally, I can find the result in Prometheus:
![Thumbnail [60x60]](https://www.dbi-services.com/blog/wp-content/uploads/2022/08/OLS_web-min-scaled.jpg)
![Thumbnail [90x90]](https://www.dbi-services.com/blog/wp-content/uploads/2022/08/ENB_web-min-scaled.jpg)
![Thumbnail [90x90]](https://www.dbi-services.com/blog/wp-content/uploads/2022/10/JPC_wev-min-scaled.jpg)
![Thumbnail [90x90]](https://www.dbi-services.com/blog/wp-content/uploads/2023/03/KKE_web-min-scaled.jpg)