At the end of part 1 the data was across, at 42,170 rows per second into a database that could not answer a single question. Every nonclustered index disabled, the largest tables loaded as heaps with no primary key, every foreign key switched off, and 4,784 views that mostly did not compile.
This part is about putting it back: translating the views, rebuilding the keys and indexes under a Standard Edition licence that makes every build offline, and compressing 3.2 TB of heaps that turned out to be mostly empty space.
The logbook resumes at day 5.
Day 5. Four thousand views to convert
4,658 of the 4,784 views live in a single schema, and nobody needed all of them. We went through the list with the client first and kept the ones that actually matter to the business, which brought the scope down to about 710. SSMA converted around 600 of those on its own.
SSMA fails mostly on CONNECT BY, START WITH and SYS_CONNECT_BY_PATH. For some easy cases, DECODE to CASE and NVL handles it well, for the record. For more complex use case, we needed to find an automatic solution process. So first, we discussed with the client to know which view were critical and needed to be migrated. Then, with this list, we leveraged the power of AI to help us converting the remaining views based on the following workflow:
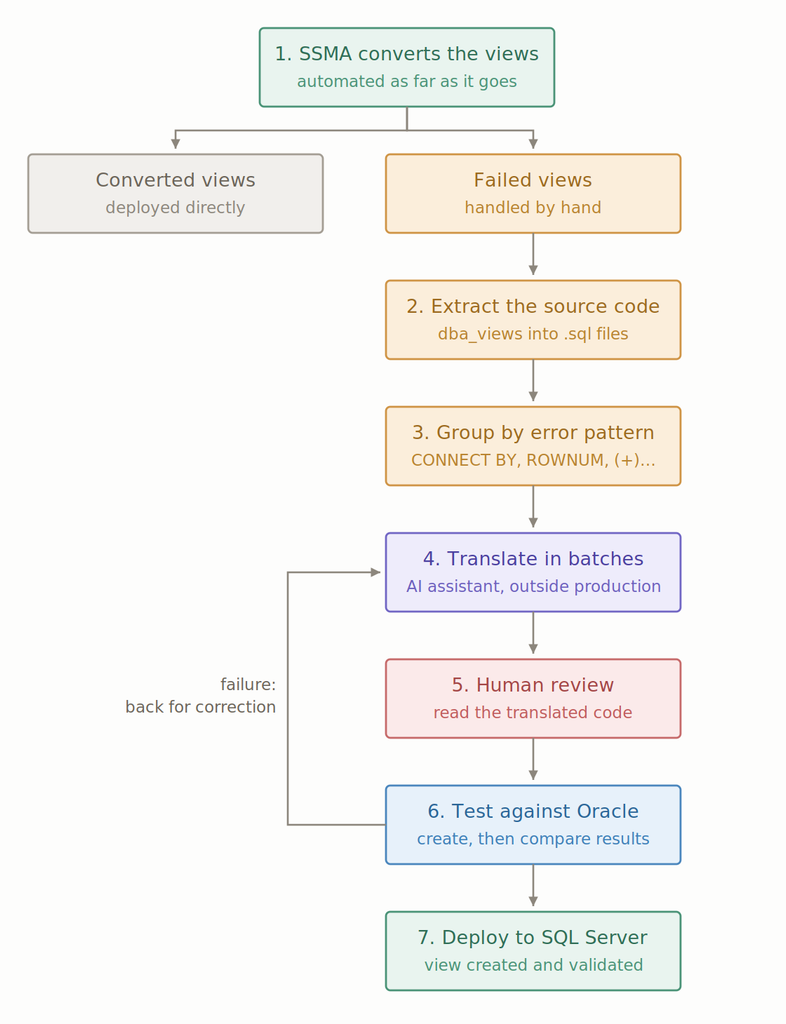
The workflow
SSMA converts what it can. The failures get extracted from dba_views into files. Then, and this is the step that changes the economics, they get classified by pattern in the Oracle source rather than one at a time by error message.
Translation itself was done in batches of one family at a time, outside production, on extracted files, with an AI assistant and a context file describing the type mapping decisions, the column types of the referenced tables and the target version. Then human review, tests against Oracle and finally, deployment.
The catalogue of families is the real deliverable. Eight of them closed the great majority of the cases:
| Family | Verdict |
|---|---|
+ concatenation on numerics (col + '_' + col) | CONCAT |
Untyped NULL in a UNION, cast to numeric(38,10) against a datetime2 sibling | retype the cast |
| Call to a package function that was never migrated | inline it if possible |
ssma_oracle.* helper functions | install the extension pack |
XML extraction (.extract().getStringVal()) | rewrite part of the query |
TO_TIMESTAMP_TZ | rewrite part of the query |
| Date arithmetic landing in float | redefine type mapping |
CONNECT BY used as a generator | materialise the level connectors |
And a word on the AI, since that is the part people ask about. No data ever left the environment: only the view definitions were processed, and every test against the live database was run by hand so we kept control of the process. We could have added MCP connectors and let a local model run the tests itself, but with the number of days allocated to the project and the small number of views left to fix, doing it manually was simpler. Around 85 percent of the views wanted by the client had already come through SSMA.
Day 6. Putting the indexes back and making the database smaller
Recovering what I had thrown away
The primary keys I dropped to load into heaps had left no trace on the SQL Server side. Nothing in sys.indexes, no disabled definition, nothing.
What Standard Edition costs
Index builds are offline and single-threaded. The table is locked for the duration, metadata reads queue behind it, but we managed to run 4 builds in parallel. SORT_IN_TEMPDB = OFF for the clustered builds. The sort covers the entire table, and 36 GB of tempdb was never going to hold a 900 GB sort.
Meanwhile percent_complete sits at 0 for the whole build, with the serene confidence of something that has never been asked to account for itself. It works for BACKUP DATABASE. It does not work here. Real progress lives in sys.dm_exec_query_profiles, operator by operator :
SET TRANSACTION ISOLATION LEVEL READ UNCOMMITTED;
SELECT physical_operator_name, row_count, estimate_row_count,
       CAST(row_count*100.0/NULLIF(estimate_row_count,0) AS decimal(5,1)) AS pct
FROM sys.dm_exec_query_profiles WITH (NOLOCK)
WHERE session_id = <spid of the build>
ORDER BY node_id;
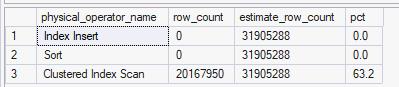
Those are not three parallel counters. They are three sequential phases of one pipeline, and only one of them moves at a time. The scan reads the source table, and while it runs its percentage is the only honest progress figure available. The sort is a blocking operator: it cannot emit a single row until it has consumed all 31.9 million, so it stays at zero through the whole scan and then through the whole sort. That is the blind spot. Once the scan reaches 100 percent you get a long stretch where all three counters report nothing while the server works flat out, and if the sort spills to disk that stretch can outlast the other two phases combined. Index Insert starts moving only when the sort begins handing rows over, and it is the first number that means the end is actually in sight.
Why compress, and what it returned
On a read-only database, PAGE compression has no recurring write cost. You keep the read benefit and pay nothing back. The argument is rarely this clean.
Compression trades CPU for I/O, and on an archive that trade is one-sided. These pages are read rarely, and when they are, nothing heavy is competing for the processor, so the decompression cost lands on a machine with nothing better to do. What you get back is density: more rows per page, which means fewer reads to find the one row somebody asked for and more of the table sitting in memory at once.
The data was unusually well suited to it, for a reason worth spelling out. These tables carry roughly 200 numeric columns, mostly null, plus five nvarchar(200) aggregation labels that repeat endlessly. Here is the part that surprises people: a fixed-length numeric column that is NULL still occupies its full width in SQL Server. “Mostly null” saves nothing before compression. It is precisely why the heap was that large, and precisely what the page dictionary destroys.
The allocated space per row tells the story:
| Table | Rows | GB (heap) | bytes allocated per row |
|---|---|---|---|
| TABLE1 | 251,777,518 | 960.5 | ~4,100 |
| TABLE2 | 229,881,717 | 876.9 | ~4,100 |
| TABLE3 | 343,997,550 | 874.8 | ~2,700 |
| TABLE4 | 447,972,849 | 227.9 | ~550 |
| TABLE5 | 519,727,931 | 120.2 | ~250 |
| TABLE6 | 505,819,544 | 117.0 | ~250 |
Three tables hold 2.7 TB of the 3.2 TB total. At around 4 KB of allocated space per row against an 8 KB page, the top two fit around two rows per page and waste most of what is left.
Then the first build, on 505,819,544 rows with a five-column primary key:
ALTER TABLE <TABLE6>
ADD CONSTRAINT PK_TABLE6 PRIMARY KEY CLUSTERED
    (<COLUMNS_NAME>)
WITH (DATA_COMPRESSION = PAGE, SORT_IN_TEMPDB = OFF);
117 GB to 30.7 GB. A ratio of 3.81.

Finally, as you can see above, more than 2.5 T have been reclaimed (datafiles were full with the heaps). Compression has made huge benefits and that means less data on disks, which means fewer pages to take in the buffer (less IO).
The script that puts everything back
Across every schema that is two cursors, one rebuilding the disabled indexes with compression and one re-enabling the foreign keys. It is driven by the same #Schemas table as the disable script in part 1:
SET NOCOUNT ON;
DECLARE @Execute bit = 0;   -- 0 = preview ; 1 = execute

DECLARE @cmd nvarchar(max);
DECLARE @n   int = 0;

DECLARE reb_cur CURSOR LOCAL FAST_FORWARD FOR
    SELECT N'ALTER INDEX ' + QUOTENAME(i.name)
         + N' ON ' + QUOTENAME(s.name) + N'.' + QUOTENAME(t.name)
         + N' REBUILD WITH (DATA_COMPRESSION = PAGE);'
    FROM   sys.indexes  i
    JOIN   sys.tables   t ON i.object_id = t.object_id
    JOIN   sys.schemas  s ON t.schema_id = s.schema_id
    WHERE  s.name IN (SELECT schema_name FROM #Schemas)
      AND  i.is_disabled = 1
    ORDER BY s.name, t.name, i.name;

OPEN reb_cur;
FETCH NEXT FROM reb_cur INTO @cmd;
WHILE @@FETCH_STATUS = 0
BEGIN
    SET @n += 1;
    PRINT @cmd;
    IF @Execute = 1
    BEGIN
        BEGIN TRY EXEC sys.sp_executesql @cmd; END TRY
        BEGIN CATCH PRINT N'   -- FAILED: ' + ERROR_MESSAGE(); END CATCH
    END
    FETCH NEXT FROM reb_cur INTO @cmd;
END
CLOSE reb_cur;
DEALLOCATE reb_cur;

PRINT N'---';
PRINT CONVERT(nvarchar(10), @n) + N' index '
    + CASE WHEN @Execute = 1 THEN N'rebuilt.' ELSE N'to be rebuilt (preview).' END;
GO


SET NOCOUNT ON;
DECLARE @Execute bit = 1;   -- 0 = preview ; 1 = executer

DECLARE @cmd nvarchar(max);
DECLARE @n   int = 0;

DECLARE fkc_cur CURSOR LOCAL FAST_FORWARD FOR
    SELECT N'ALTER TABLE ' + QUOTENAME(s.name) + N'.' + QUOTENAME(t.name)
         + N' WITH NOCHECK CHECK CONSTRAINT ' + QUOTENAME(fk.name) + N';'
    FROM   sys.foreign_keys fk
    JOIN   sys.tables  t ON fk.parent_object_id = t.object_id
    JOIN   sys.schemas s ON t.schema_id = s.schema_id
    WHERE  s.name IN (SELECT schema_name FROM #Schemas);

OPEN fkc_cur;
FETCH NEXT FROM fkc_cur INTO @cmd;
WHILE @@FETCH_STATUS = 0
BEGIN
    SET @n += 1;
    PRINT @cmd;
    IF @Execute = 1
    BEGIN
        BEGIN TRY EXEC sys.sp_executesql @cmd; END TRY
        BEGIN CATCH PRINT N'   -- FAILED : ' + ERROR_MESSAGE(); END CATCH
    END
    FETCH NEXT FROM fkc_cur INTO @cmd;
END
CLOSE fkc_cur;
DEALLOCATE fkc_cur;

PRINT N'---';
PRINT CONVERT(nvarchar(10), @n) + N' FK '
    + CASE WHEN @Execute = 1 THEN N'activated and validated.' ELSE N'to be activated (preview).' END;
GO
The foreign keys, which turned out to be free
All 6,072 foreign keys were already back, active and marked not trusted, because the loading script re-enabled them with NOCHECK. Revalidating them with WITH CHECK would mean full joins against the largest tables in the database.
On a read-only archive whose source integrity was enforced by Oracle for fifteen years, that buys one thing: the optimizer regains the right to eliminate redundant joins. Worth having on a schema of deeply nested views, not worth days of scanning here. They stayed not trusted.
Day 7. Testing 600 views
The principle is simple: run every view, record what happened, and never lose the record. Each one gets a SELECT TOP (100) * inside a TRY/CATCH, so a view that fails is logged rather than fatal, and the outcome lands in a table with its duration in milliseconds. The cursor only picks up views that are not already recorded, which means an interrupted run resumes where it stopped instead of starting over, and the duration column is what you sort on once it is done:
SET NOCOUNT ON;

IF OBJECT_ID('dbo.ViewTestResults') IS NULL
    CREATE TABLE dbo.ViewTestResults (
        schema_name  sysname,
        view_name    sysname,
        statut       varchar(20),
        duree_ms     int,
        message      nvarchar(2048),
        tested_at    datetime2 DEFAULT SYSDATETIME(),
        CONSTRAINT PK_ViewTestResults PRIMARY KEY (schema_name, view_name)
    );

DECLARE @sch sysname, @vue sysname, @sql nvarchar(max), @t0 datetime2, @ms int, @i int = 0, @n int;

SELECT @n = COUNT(*)
FROM   sys.views v JOIN sys.schemas s ON v.schema_id = s.schema_id
WHERE  s.name = 'SCDAT'
  AND  NOT EXISTS (SELECT 1 FROM dbo.ViewTestResults r
                   WHERE r.schema_name = s.name AND r.view_name = v.name);

RAISERROR('=== %d view remaining ===', 0, 1, @n) WITH NOWAIT;

DECLARE c CURSOR FAST_FORWARD FOR
  SELECT s.name, v.name
  FROM   sys.views v JOIN sys.schemas s ON v.schema_id = s.schema_id
  WHERE  s.name = 'SCDAT'
    AND  NOT EXISTS (SELECT 1 FROM dbo.ViewTestResults r
                     WHERE r.schema_name = s.name AND r.view_name = v.name)
  ORDER  BY v.name;

OPEN c;
FETCH NEXT FROM c INTO @sch, @vue;
WHILE @@FETCH_STATUS = 0
BEGIN
    SET @i += 1;
    RAISERROR('[%d/%d] %s.%s', 0, 1, @i, @n, @sch, @vue) WITH NOWAIT;

    SET @t0 = SYSDATETIME();
    BEGIN TRY
        SET @sql = N'SELECT TOP (100) * FROM ' + QUOTENAME(@sch) + N'.' + QUOTENAME(@vue) + N';';
        EXEC sp_executesql @sql;
        SET @ms = DATEDIFF(MILLISECOND, @t0, SYSDATETIME());
        INSERT dbo.ViewTestResults (schema_name, view_name, statut, duree_ms, message)
        VALUES (@sch, @vue, 'OK', @ms, NULL);
    END TRY
    BEGIN CATCH
        SET @ms = DATEDIFF(MILLISECOND, @t0, SYSDATETIME());
        INSERT dbo.ViewTestResults (schema_name, view_name, statut, duree_ms, message)
        VALUES (@sch, @vue, 'FAILED', @ms, ERROR_MESSAGE());
        RAISERROR('    -> FAILED: %s', 0, 1, @vue) WITH NOWAIT;
    END CATCH

    FETCH NEXT FROM c INTO @sch, @vue;
END
CLOSE c; DEALLOCATE c;

RAISERROR('=== Done ===', 0, 1) WITH NOWAIT;

-- summary
SELECT statut, COUNT(*) AS nb, SUM(duree_ms) AS duree_totale_ms
FROM dbo.ViewTestResults GROUP BY statut;

-- failed
SELECT schema_name, view_name, duree_ms, message
FROM dbo.ViewTestResults WHERE statut='FAILED' ORDER BY view_name;

-- all
SELECT schema_name, view_name, statut, duree_ms
FROM dbo.ViewTestResults ORDER BY duree_ms DESC;
The result looked excellent: 604 views OK, zero errors, against real data. Six skipped because they are not implemented to be run without an explicit filter added. SELECT TOP 100 * without a filter is not a representative test but still confirms that definition and joins are working fine. So: test with the filter the users will actually write. A view that only misbehaves when queried in a way nobody queries it is not a broken view, but you cannot know that from a green tick.
Day 8. Closing the hatch
Database set to read-only, final backup taken and user’s specific queries tested with success, the story now comes to a happy end.
What I would tell the next person
An archive migration is not a cheap application migration. It is a different decision set, and read-only is the input that drives most of it. 25,000 triggers are pointless, PAGE compression free, and untrusted foreign keys perfectly acceptable. It even tells you how to index: broadly and in advance, because nobody can tell you which row an auditor will want in three years. Before anything else, ask what the target will be used for. The answer rewrites the plan before the first byte moves.
Measure, and distrust anything that presents itself as progress. The SSMA counter refreshes per batch and sits still for minutes at a time. percent_complete stays at zero for an entire index build. A green tick on SELECT TOP 100 confirms that the joins resolve and nothing beyond that. In every one of those cases the real number was sitting in a DMV.
On views, the conversion rate is the least useful number in the report. What made four thousand views a finite piece of work was not the translation but the two steps around it: agreeing the real scope with the client first, then classifying what remained by pattern in the Oracle source rather than one error message at a time. An AI assistant translates a family of twenty views very well. It validates nothing, and the test against the source stays yours.
Compression on an archive is the rare decision with nothing to weigh against it. 117 GB down to 30.7 GB on the first table, more than 2.5 TB reclaimed across the set, and not a single write to pay it back with. If your heap is mostly null numeric columns, it is bigger than you think, and it will compress better than you expect.
![Thumbnail [60x60]](https://www.dbi-services.com/blog/wp-content/uploads/2025/11/LTO_WEB.jpg)
![Thumbnail [90x90]](https://www.dbi-services.com/blog/wp-content/uploads/2025/05/JDE_Web-1-scaled.jpg)
![Thumbnail [90x90]](https://www.dbi-services.com/blog/wp-content/uploads/2024/03/AHI_web.jpg)
![Thumbnail [90x90]](https://www.dbi-services.com/blog/wp-content/uploads/2022/08/MAW_web-min-scaled.jpg)