Introduction
Monitoring a PostgreSQL environment involves much more than simply checking whether the database is running. In a modern high availability architecture, multiple components work together to keep the service available and stable.
In this article, we will explain how to monitor a PostgreSQL cluster environment with Zabbix:
- PostgreSQL
- Patroni
- HAProxy
- ETCD
- Keepalived
The goal of this blog is to provide a simple and clear overview that can be understood by both beginners and experienced administrators.
PostgreSQL High Availability Architecture
A typical PostgreSQL high availability environment often contains several components:
| Component | Role |
|---|---|
| PostgreSQL | Database engine |
| Patroni | PostgreSQL cluster management and failover |
| ETCD | Distributed key-value store used by Patroni |
| HAProxy | Load balancing and traffic routing |
| Keepalived | Virtual IP management and failover |
| Zabbix | Monitoring and alerting platform |
In a PostgreSQL HA environment, monitoring only the database is not enough because every component directly impacts cluster stability and application availability. Moreover, a failures in components like HAProxy, ETCD, or Keepalived can directly impact application availability and cluster stability. Comprehensive monitoring ensures the entire ecosystem remains healthy and operational.
Monitoring PostgreSQL with Zabbix
Zabbix already provides an official PostgreSQL template.
This template allows administrators to monitor:
- Database availability
- Connections
- Transactions
- Cache hit ratio
- Replication status
- Locks
- Deadlocks
- Database size
- Query statistics
- WAL activity
- Performance metrics
Therefore, using the official template is usually the fastest and easiest way to start monitoring PostgreSQL.
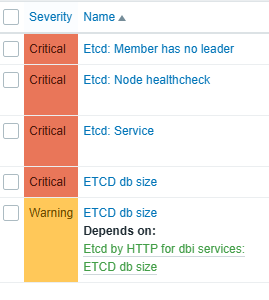
ETCD
Zabbix already provides an official template for ETCD monitoring.
The template uses HTTP Agent items to collect metrics directly from the /metrics endpoint exposed by ETCD.
In addition, the template works without external scripts and uses Prometheus-style metrics collection.
The official template already includes many useful triggers and metrics for monitoring ETCD health, performance, and cluster activity.
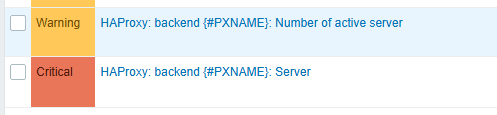
HAProxy
HAProxy plays a critical role in a PostgreSQL high availability environment, ensuring that client connections are automatically routed to the correct PostgreSQL node and maintaining application connectivity during failovers.
Zabbix already provides an official HAProxy monitoring template that can be used as a base for monitoring and customization: HAProxy by HTTP
The number of active servers in HAProxy is also monitored by the template. However, the template does not create a trigger by default for this metric. This means that a backend could lose one or more active servers without generating any alert in Zabbix. For this reason, it is highly recommended to create custom triggers on this item to immediately detect backend availability issues and avoid unnoticed service degradation.
To implement this properly, a new macro should be created in the template to define the minimum expected number of active servers. Then, a custom trigger must be added on the item prototype available in the Low-Level Discovery (LLD) section of the template. Consequently, Zabbix can automatically monitor and alert on all discovered HAProxy backends.
Patroni
Zabbix does not directly include Patroni monitoring in the standard PostgreSQL templates.
One approach is to use the Zabbix Systemd template, which allows monitoring of services running on the server. In this case, it is simply necessary to filter on the patroni service name to verify that the service is active.
Another approach is to create a custom item in a template using a Zabbix agent item with the following key:
net.tcp.service["{$HAPROXY.STATS.SCHEME}","{$HAPROXY.STATS.HOST}","{$HAPROXY.STATS.PORT.PATRONI}"]
This item performs a direct HTTP TCP connection test on port 5000, which is commonly used by the Patroni API. This configuration allows Zabbix to verify that the Patroni service responds correctly and remains reachable.
Additionally, combining both monitoring methods significantly improves monitoring reliability.
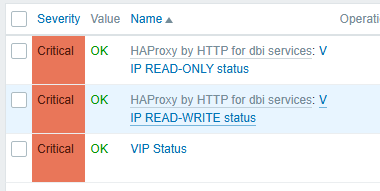
Monitoring Keepalived
Keepalived monitoring is not included by default in the standard Zabbix templates.
To properly monitor the VIP management layer, administrators should create custom items whether the Virtual IP (VIP) is correctly present on one of the cluster nodes.
A common approach is to create three different items:
- Two items using the
net.tcp.servicekey to test TCP connectivity for:- the READ-ONLY access
- the READ-WRITE access
- One additional item using a
system.runcommand to directly verify the VIP status on the server.
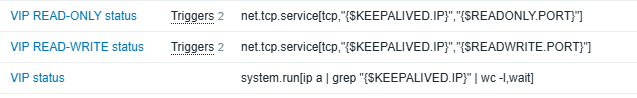
Together, these checks help ensure that:
- the VIP is correctly assigned
- the PostgreSQL services are reachable
- the failover mechanism is working properly
Finally, administrators should create the appropriate triggers for these items in order to immediately detect VIP failover or connectivity issues.
Conclusion
In conclusion, monitoring PostgreSQL alone is not enough in a high availability environment.
A complete monitoring strategy must include:
- PostgreSQL
- Patroni
- HAProxy
- ETCD
- Keepalived
Using Zabbix with both official and custom templates provides a centralized and efficient monitoring solution.
The PostgreSQL template available in Zabbix already offers excellent database monitoring capabilities.
Additional templates for ETCD and HAProxy help extend monitoring to the full HA architecture and improve visibility across the entire platform.
As a result, this approach helps administrators detect failures earlier, improve troubleshooting, and ensure better service availability.
If you need you can try other blogs regarding Zabbix or postgreSQL here: dbi Blog
![Thumbnail [60x60]](https://www.dbi-services.com/blog/wp-content/uploads/2023/01/APY_web-scaled.jpg)
![Thumbnail [90x90]](https://www.dbi-services.com/blog/wp-content/uploads/2022/08/STH_web-min-scaled.jpg)
![Thumbnail [90x90]](https://www.dbi-services.com/blog/wp-content/uploads/2025/11/LTO_WEB.jpg)