A couple of weeks ago, I had an interesting discussion with one of my friend that faced a weird issue with a SQL Server instance that lacked worker threads. Because I can’t use his own information I decided to reproduce the same issue in order to share with you some interesting information. So the next part of this blog post refers exclusively to my own test but it represents exactly the real issue encountered by my friend.
Let’s set the scene: in the SQL Server error log we found the following records related to our issue:
2015-04-16 14:06:16.54 Server New queries assigned to process on Node 0 have not been picked up by a worker thread in the last 300 seconds. Blocking or long-running queries can contribute to this condition, and may degrade client response time. Use the “max worker threads” configuration option to increase number of allowable threads, or optimize current running queries. SQL Process Utilization: 0%. System Idle: 94%.
2015-04-16 14:11:16.74 Server New queries assigned to process on Node 0 have not been picked up by a worker thread in the last 600 seconds. Blocking or long-running queries can contribute to this condition, and may degrade client response time. Use the “max worker threads” configuration option to increase number of allowable threads, or optimize current running queries. SQL Process Utilization: 0%. System Idle: 92%.
In the same time, we found an event related to the generation of a SQL Server dump file triggered by the deadlock schedulers monitor as follows:
I began my investigation by having a first look at the SQL Server error log file but I didn’t find any relevant information. So, I decided to move on the analysis of the dump file.
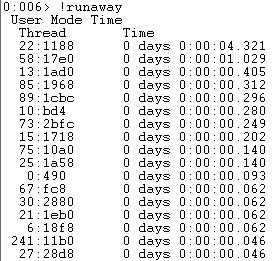
My first idea was to look at the runaway threads at the moment of the dump file generation (!runawaycommand). In fact, I suspected first a high-CPU workload because I didn’t get other information from my friend. Here what I found:

557 threads in use at the moment of the generation of the dump file. According to the Microsoft documentationhere and the concerned SQL Server infrastructure (4 logical processors and max worker thread option = 0), the number of running threads are greater than maximum of configured SQL Server threads equal to 512 in this case.
SQL Server detected 2 sockets with 2 cores per socket and 2 logical processors per socket, 4 total logical processors;
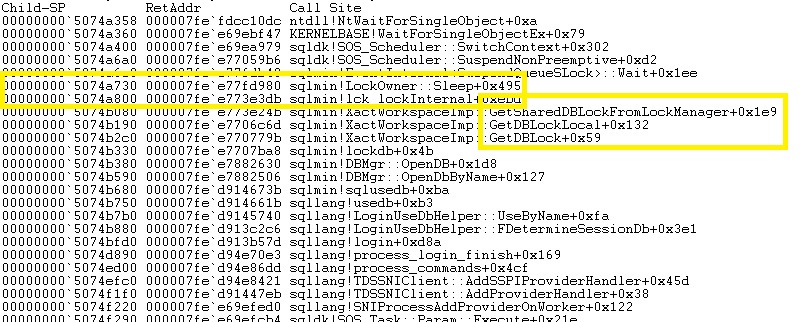
We found a lot of thread patterns that seem blocked by a database lock.

Note in this case that SQL Server has decided to switch off the “tied” thread but it is still waiting to be signaled that the database lock is available to continue …
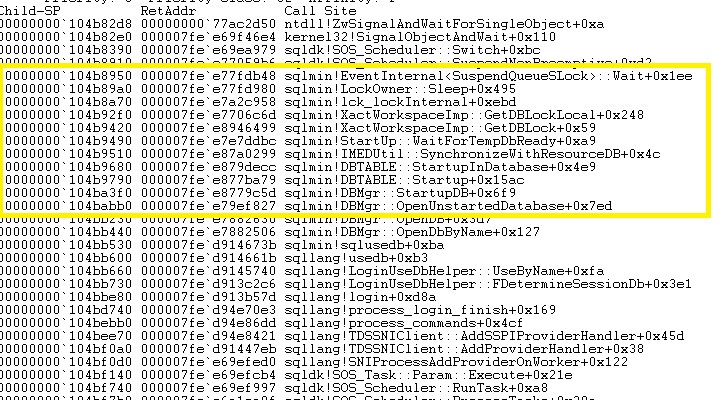
Another piece of interesting call stack is the following:

This above call stack seems to concern the SQL Server start-up process. Let’s take a look at the functions likesqlmin!DBMgr::OpenUnstartedDatabase, sqlmin!DBMgr::StartupDB orsqlmin!IMEDUtil::SynchronzeWithResourceDB .We can also notice the use of the functionsqlmin!StartUp::WaitForTempdbReady that seems to be related to tempdb database readiness. After that, the concerned thread is also waiting on the database lock to be available and we don’t see any functions that state tempdb is ready at the moment of the dump file generation.
Well, to summarize we are facing a general locking issue inside SQL Server process that has consumed all of available threads and we may think that tempdb readiness has something to do with this our blocking issue.
So now, let’s go back to the SQL Server error log and let’s have a deeper look at the SQL Server error log event. At this point, I remembered the famous Bob Ward’s session at Summit 2011 about tempdb database in which he explained the importance of tempdb database during the SQL Server start-up process because even if SQL Server is ready for user connections. Indeed, they have to wait until tempdb has really started and it makes sense because we can wonder what’s going on if tempdb database cannot start correctly. Do we allow user connections to perform their work? As a reminder, the unavailability of tempdb is considered as a SQL Server shutdown event.
In my context we found effectively that the tempdb database was ready only 40 minutes after SQL Server was ready for user connections as follows:
The $100 dollar question: Why tempdb started so slowly? Well, I didn’t have all information but my friend told me that they had a storage maintenance at the time … maybe we may correlate these two events together but without any further investigation, it is not possible to respond correctly about it.
Anyway it was very interesting to see how the tempdb database may trigger an escalade of issues in this case. There are probably a lot of ways to reproduce this issue.
Finally let me finish my blog post by explaining my test scenario. In fact to simulate the same issue than my friend, I created first a very big user table inside the model database to considerably slow down the start-up of my tempdb database. Then I configured tempdb with big database files in size without instant file initialization (zeroing is mandatory in this case for all of database files). In the same time, I used ostress tool to simulate roughly 600 running threads. Finally I let the magic happens …
I hope this blog will help you in your database administrator daily work.
By David Barbarin
![Thumbnail [60x60]](https://www.dbi-services.com/blog/wp-content/uploads/2022/12/microsoft-square.png)
![Thumbnail [90x90]](https://www.dbi-services.com/blog/wp-content/uploads/2022/08/DWE_web-min-scaled.jpg)