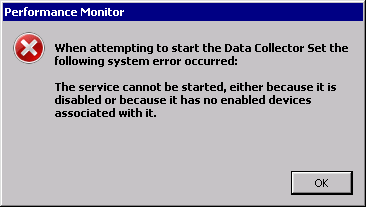
I have recently used perfmon (performance monitor) at a customer site. I created a Data Collector Set to monitor CPU, Memory, Disk, and Network during one day. Then, I ran the monitor and I received a “beautiful” error message…
What happened? 😉
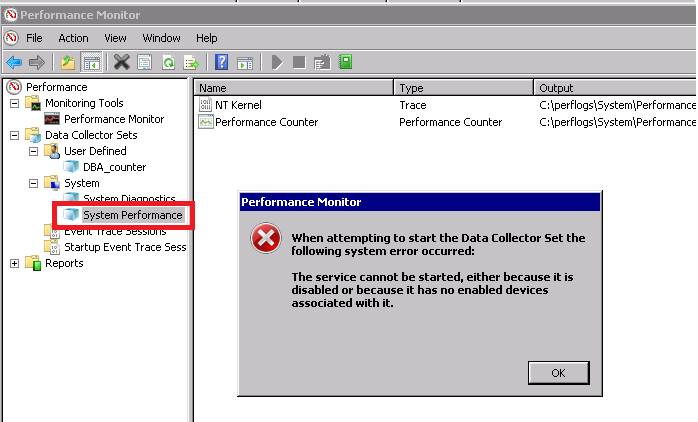
Ok, to be sure that it was not a rights or a setting problem in my Data Collector Set, I tried with a System Data Collector Set and got the same error.
I read the event viewer and no error or information was listed.
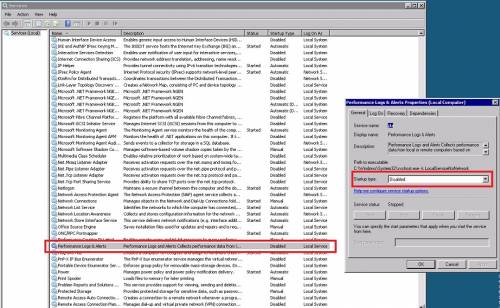
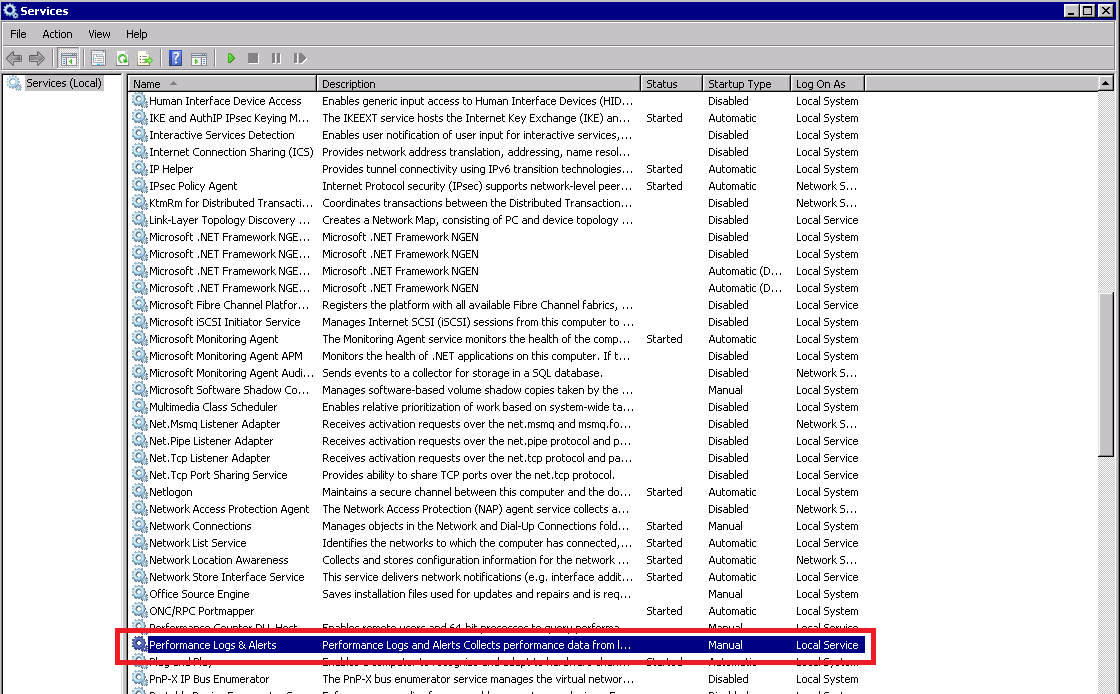
Since the message said the service cannot be started, I ran the services manager from Windows server and I discovered that the “Performance Logs and Alerts” service is in disabled state.
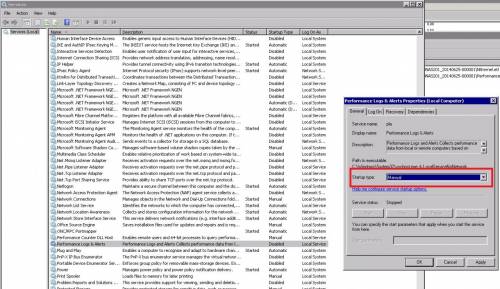
I changed the mode to manual but did not start it.
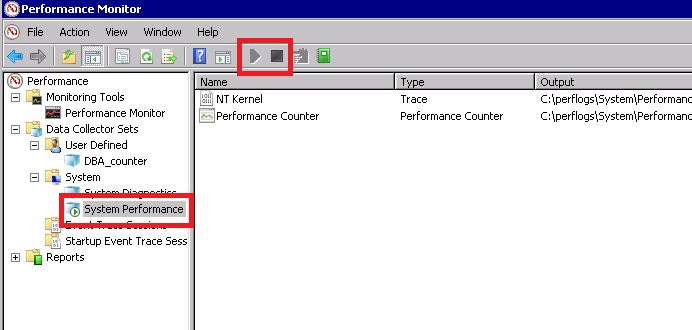
I returned to the performance monitor tool to first run a system Data Collector Set to be sure that it works fine!
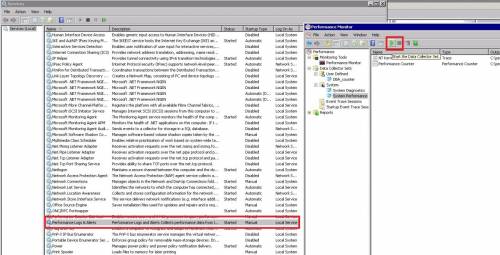
I looked up the service manager and see that the “Performance Logs and Alerts” has started.
When stopping the monitoring, we can see that the service continues to run.
Finally, when our monitoring is finished, I am ale to stop the service and disable it.
TIPS
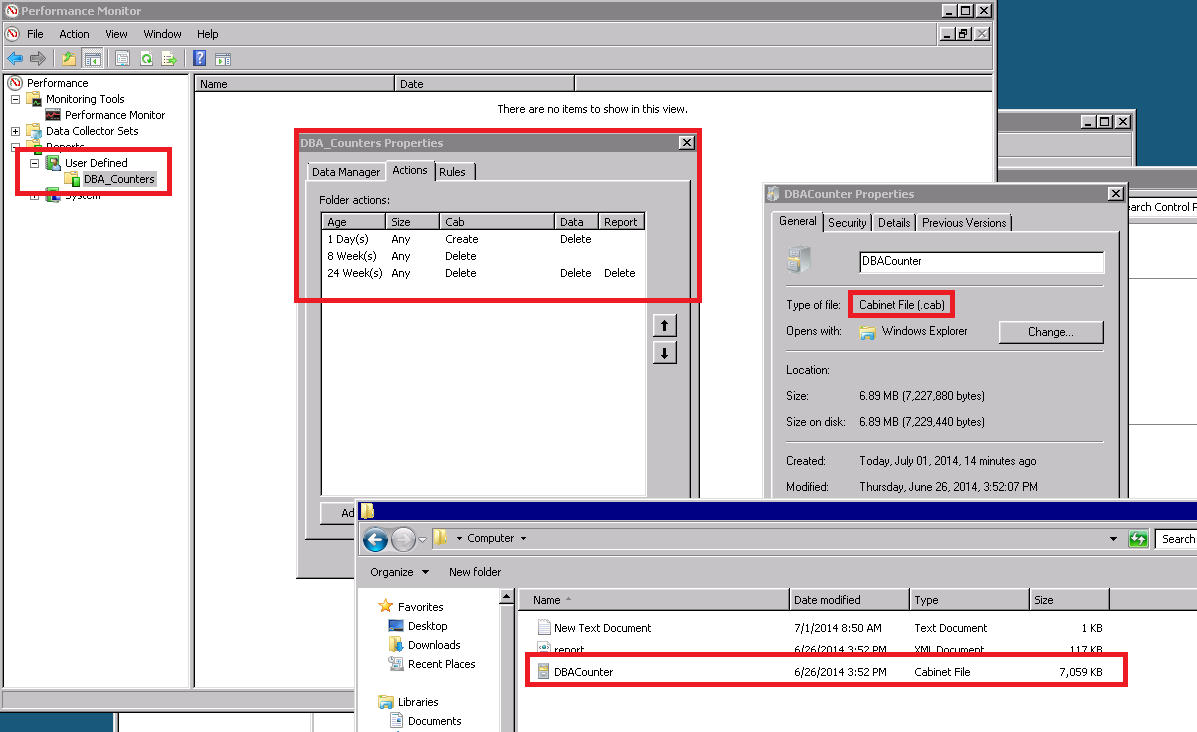
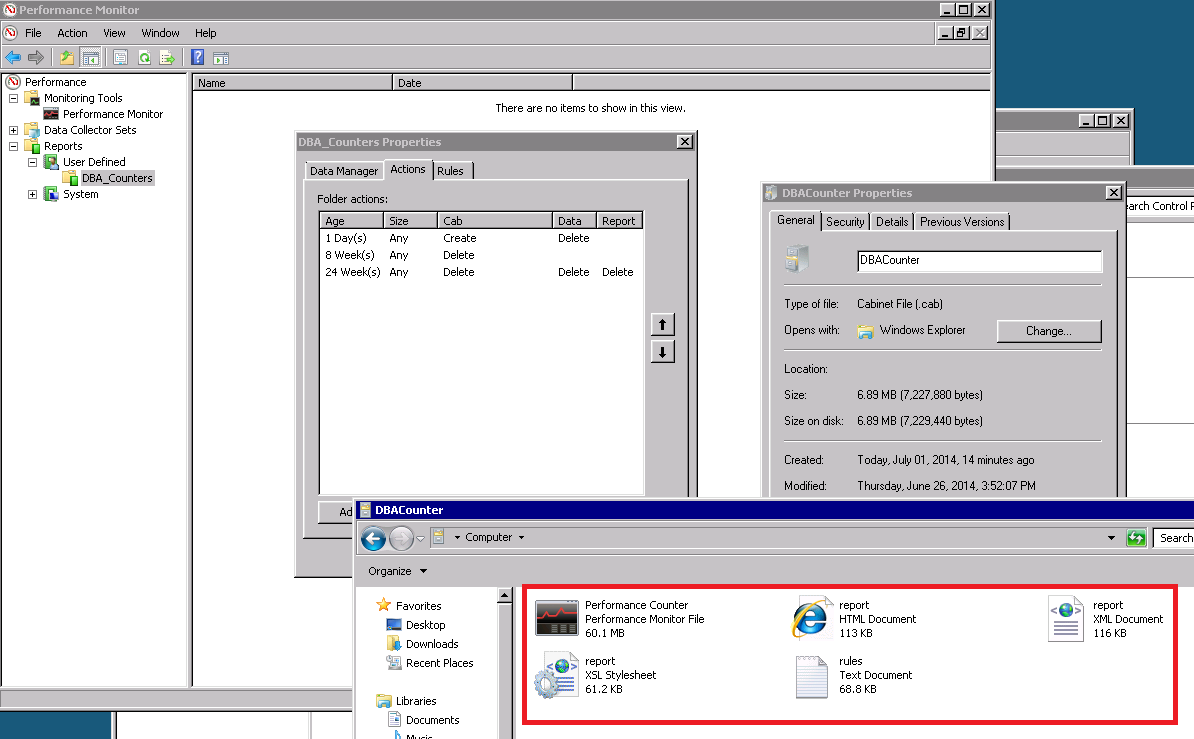
Another important point is that per default, for a user-defined Data Collector Set, after one day, the data is stored in a cab file and directly deleted. After 8 weeks, the cab file is deleted.
Double-click on the cab file to see all data files from your monitoring:
My conclusion: Perfmon is a really good cost-free tool for monitoring, but you need to know a few things before using it.
![Thumbnail [60x60]](https://www.dbi-services.com/blog/wp-content/uploads/2022/08/STH_web-min-scaled.jpg)
![Thumbnail [90x90]](https://www.dbi-services.com/blog/wp-content/uploads/2022/08/OLS_web-min-scaled.jpg)